#!/usr/bin/env python
# coding: utf-8
# # Data Visualization
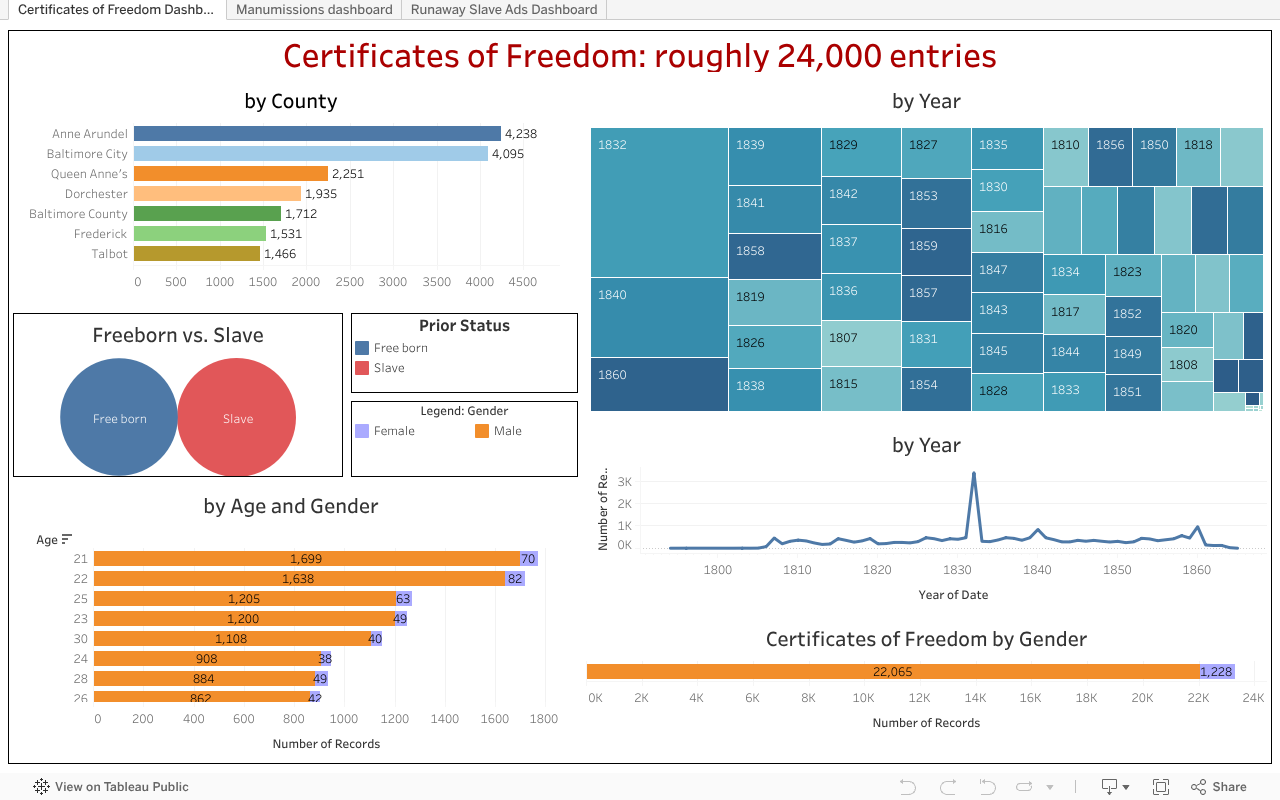
# Is there a high level visualization that captures the outcomes of this module in visual form? Show the work done to create that visualization, or describe the process.
# Then embed that visualization in the notebook. Interactive visualizations that encourage data exploration are best and may be created in Plotly and other such tools.
# In[4]:
get_ipython().run_cell_magic('HTML', '', " \n")
# # Review
# Briefly review the goals and the different steps taken to acheive them in your notebooks.
#
# # Conclusion
# Discuss whether your goals were met by this analysis.
# List the techniques and expertise the student shall have learnt by studying these notebooks.
# You can also incorporate a student reflection area in the conclusion, where you encourage them to
# consider various dimensions of the analysis and write about what they have learned.
# In[ ]: