#!/usr/bin/env python
# coding: utf-8
# # Redlining Baltimore CASE Module
# ### An educational notebook demonstrating computational archival techniques on the Baltimore dataset created from The National Archive's Home Owners' Loan Corperation Records
#
# * Contributors: Sarah Agarrat, Richard Marciano
# * Source Available: https://github.com/cases-umd/Baltimore-Redlining.git
# * License: [Creative Commons Attribution-NonCommercial-ShareAlike 4.0 International License](http://creativecommons.org/licenses/by-nc-sa/4.0/)  # * More Information: [Mapping Inequality Website](https://dsl.richmond.edu/panorama/redlining/#loc=4/36.71/-96.93&opacity=0.8)
# ## Introduction
# After the [1929 Stock Market Crash](https://en.wikipedia.org/wiki/Wall_Street_Crash_of_1929), thousands of Americans were in danger of home foreclosure. To address this problem and stabilize the market, The Home Owners Loan Coperation (HOLC) was created under the Rooselvelt Administration to asses credibility of families in order to decide to refinance their homes.
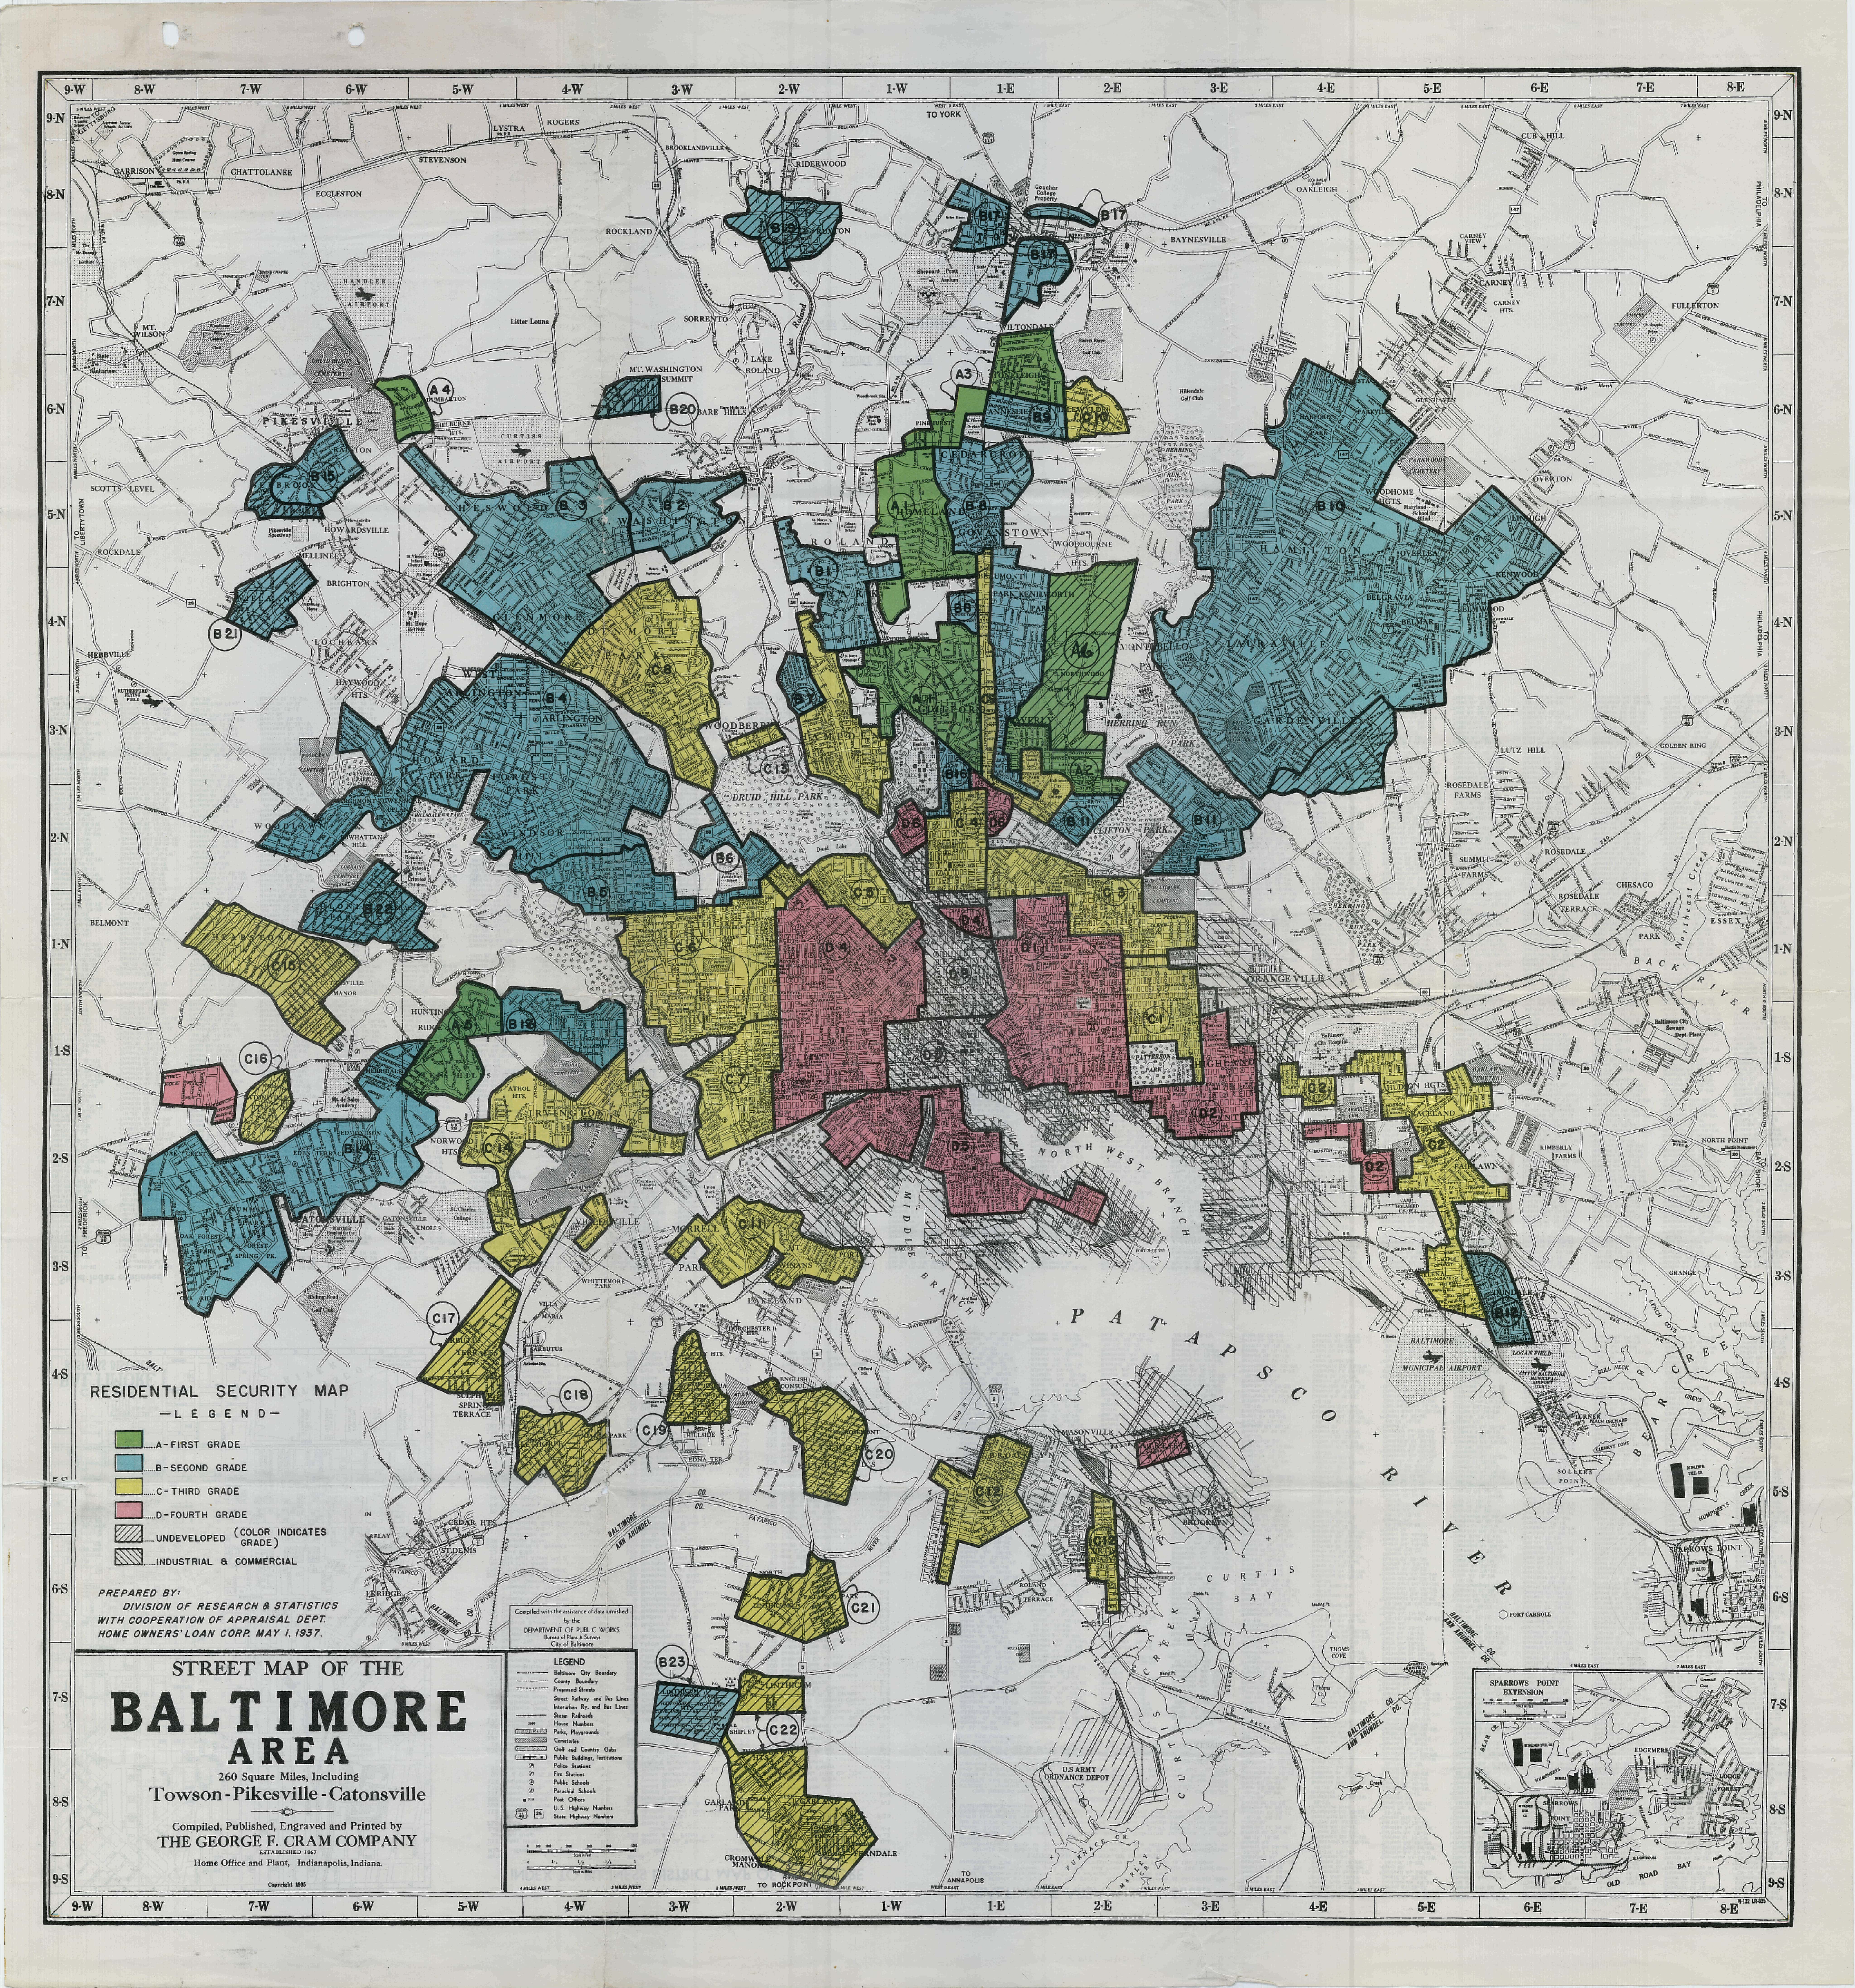
# The HOLC created area descriptions and maps to "grade" neighborhoods based on racial/ethnic presence, the income of the residents, and environmental factors to determine their "financial risk". A grade of an 'D' (red) , was given to an area characterized as undesirable due to detrimental influences and unfavorable infiltration. Grade 'C' (yellow) areas were characterized by infiltration of a "lower grade population", "lacking homogeniety", and age of the neighborhoods, grade 'B' (blue) areas were completely developed, and 'grade 'A' (green) areas were characterized as "hot spots" that weren't fully built up yet and contained homogeinety. This is called [__*redlining*__](https://en.wikipedia.org/wiki/Redlining), denying financial services based on race/ethnic background.
This module stems from the __Mapping Inequality Project__, a big cultral data project which uses archival practices and digital curation techniques to curate the HOLC collections, extract information from the text, and share the information with the public.
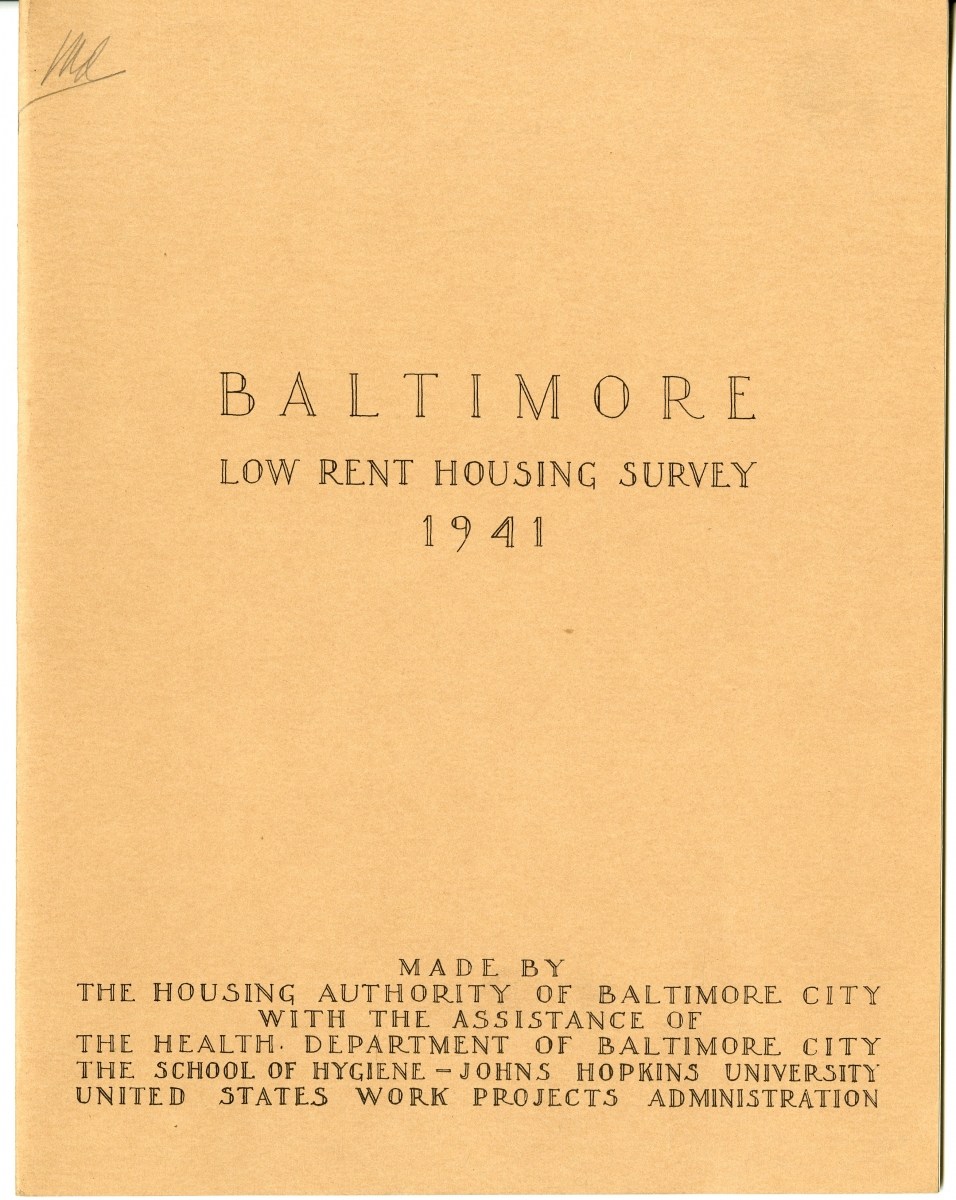
# This is important because the HOLC records are currently stored at [National Archives, College Park](https://www.archives.gov/college-park) in RG 195: General Records of the Department of Housing and Urban Development and can only be accessed by physically visiting the center and accessing the records.
This module is inspired by __Mapping Inequality: Baltimore __, a Maryland Day 2016 presentation which discussed the [history](https://dcicblog.umd.edu/redliningbaltimore/baltimores-history/) of redlining in particulary Baltimore and showcased HOLC Baltimore archival documents and the [interactive Baltimore security grade map](https://dsl.richmond.edu/panorama/redlining/#loc=11/39.2923/-76.6331&opacity=0.8&city=baltimore-md). # ## Motivation
#
# In this module, we would like to demonstrate different ways to extract information from text values. This will allow us to begin to visualize the content of the records and analyze the survey methodology of the Home Owners' Loan Corporation in 1930's Baltimore.
# ## Learning Goals
# ### Archival Practices
# *TBD*
# ### Computational Practices
# - Data Practices
# - Creating Data
# - Manipulating Data
# - Analyzing Data
# - Visualizing Data
# - Computational Problem Solving Practices
# - Computer programming
# - Developing Modular Computational Solutions
# - Troubleshooting and Debugging
# ### Ethical Concerns
# *TBD*
# ## Software and Tools
#
  #
#  #
#  # ## Acquiring or Accessing the Data
# We used a crowdsourcing platform called [Scribe](https://github.com/AI-Collaboratory/Scribe) to transcribe and digitilize HOLC forms.
The output is a JavaScript Object Notation file that has been converted into Comma-Seperated Value file for the purpose of analysis. The files used in this module can be accessed below :
# - [AD_Data_BaltimoreProject.csv](AD_Data_BaltimoreProject.csv)
#
# There are no other data files needed to run this module. Morever, the outputs for other HOLC cities can be found on the Scribe github repository.
# ## Notebooks
# This module is organized into three Python notebooks:
# 1. [Data Cleaning and Preparation](Data_Cleaning_and_Preparation.ipynb)
# 2. [Data Manipulation](Data_Manipulation.ipynb)
# 3. [Data Analysis and Visualization](Data_Visualization.ipynb)
# In[ ]:
 # * More Information: [Mapping Inequality Website](https://dsl.richmond.edu/panorama/redlining/#loc=4/36.71/-96.93&opacity=0.8)
# ## Introduction
# After the [1929 Stock Market Crash](https://en.wikipedia.org/wiki/Wall_Street_Crash_of_1929), thousands of Americans were in danger of home foreclosure. To address this problem and stabilize the market, The Home Owners Loan Coperation (HOLC) was created under the Rooselvelt Administration to asses credibility of families in order to decide to refinance their homes.
# The HOLC created area descriptions and maps to "grade" neighborhoods based on racial/ethnic presence, the income of the residents, and environmental factors to determine their "financial risk". A grade of an 'D' (red) , was given to an area characterized as undesirable due to detrimental influences and unfavorable infiltration. Grade 'C' (yellow) areas were characterized by infiltration of a "lower grade population", "lacking homogeniety", and age of the neighborhoods, grade 'B' (blue) areas were completely developed, and 'grade 'A' (green) areas were characterized as "hot spots" that weren't fully built up yet and contained homogeinety. This is called [__*redlining*__](https://en.wikipedia.org/wiki/Redlining), denying financial services based on race/ethnic background.
 # ## Motivation
#
# In this module, we would like to demonstrate different ways to extract information from text values. This will allow us to begin to visualize the content of the records and analyze the survey methodology of the Home Owners' Loan Corporation in 1930's Baltimore.
# ## Learning Goals
# ### Archival Practices
# *TBD*
# ### Computational Practices
# - Data Practices
# - Creating Data
# - Manipulating Data
# - Analyzing Data
# - Visualizing Data
# - Computational Problem Solving Practices
# - Computer programming
# - Developing Modular Computational Solutions
# - Troubleshooting and Debugging
# ### Ethical Concerns
# *TBD*
# ## Software and Tools
#
  #
#  #
#  # ## Acquiring or Accessing the Data
# We used a crowdsourcing platform called [Scribe](https://github.com/AI-Collaboratory/Scribe) to transcribe and digitilize HOLC forms.