#!/usr/bin/env python
# coding: utf-8
# Revisualizing Charlotte: Viewing Racial Inequity Geographically without GIS
#
# ### Summary of Findings
# 
#
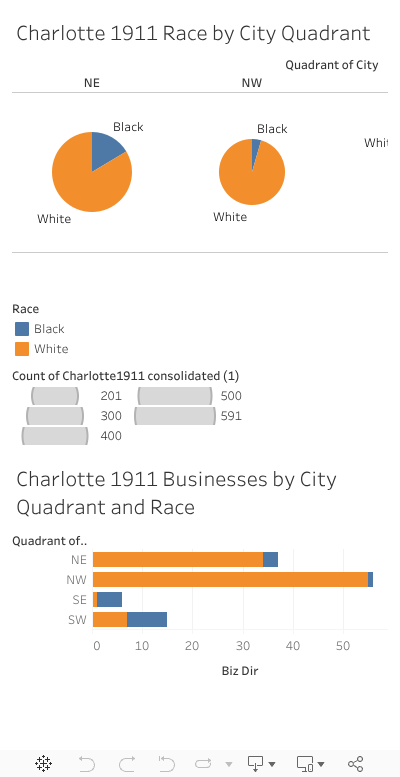
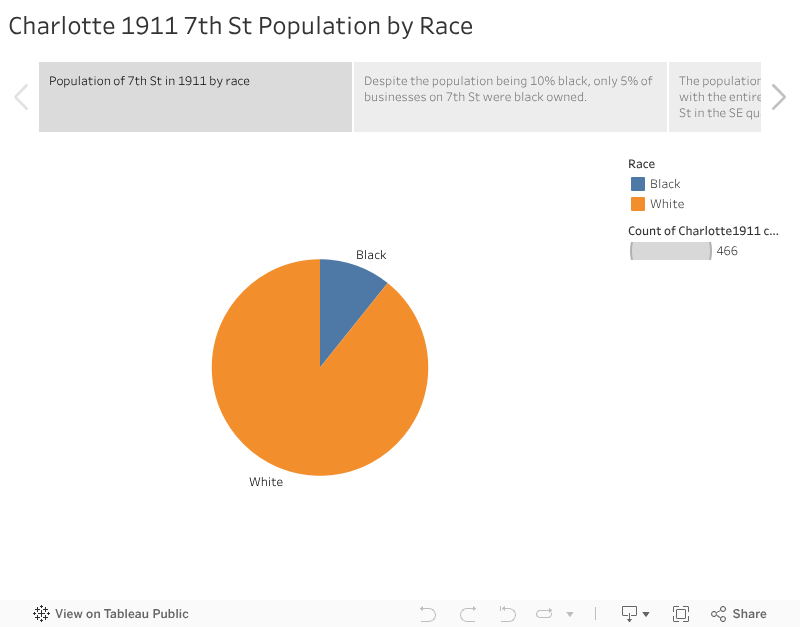
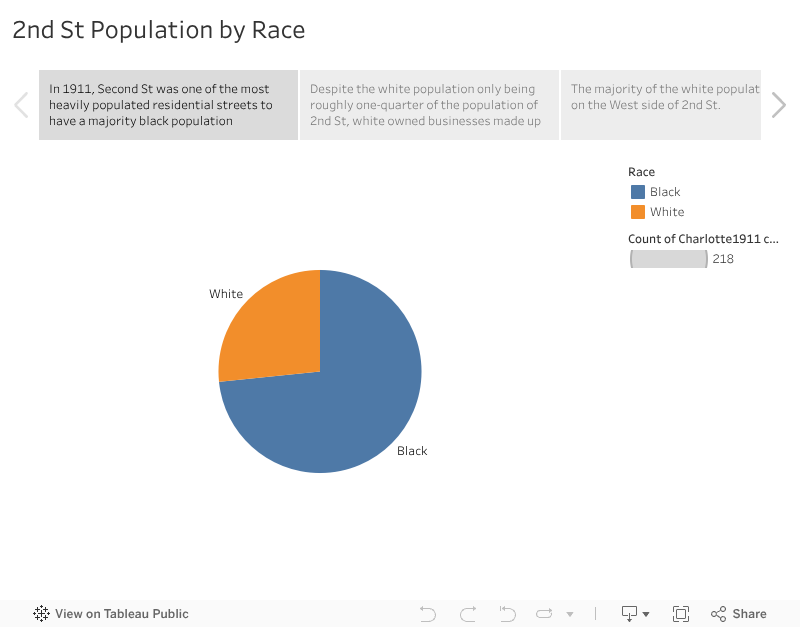
# Using Tableau Public to visualize the cleaned Charlotte 1911 data for 2nd, 7th, Graham, and Davidson Streets based on street direction and city quadrant by total population, numbers of businesses, and race revealed stark patterns in racial demographics and economic disparities by geographic location in the city.
#
#
#
# [Charlotte 1911 Quadrant Dashboard](https://public.tableau.com/views/Charlotte1911RacialandEconomicDisparitiesbyGeographicDistributionDashboard/Dashboard1?:language=en-US&publish=yes&:display_count=n&:origin=viz_share_link)
#
#
# [Charlotte 1911 7th St Story](https://public.tableau.com/views/Charlotte19117thStStPopulationRaceandBusinessOwnership/Story1?:language=en-US&publish=yes&:display_count=n&:origin=viz_share_link)
#
#
# [Charlotte 1911 2nd St Story](https://public.tableau.com/views/Charlotte19112ndStPopulationRaceandBusinessOwnership/Story1?:language=en-US&:display_count=n&:origin=viz_share_link)
#
# Return: [Main Notebook](5.RevisualizingGeographicDisparities.ipynb)