Data Manipulation
This project uses a few basic manipulations in OpenRefine and Excel to find the most populous streets in Charlotte in 1911 and to add columns for street direction and city quadrant to the data for those streets so that it can be used to perform geographic analysis and visualization of the racial and economic data for the selected area. (The base data used for this project is a consolidated Excel file for the entire Charlotte 1911 City Directory provided by the instructor of INST 742, Dr. Richard Marciano.)
OpenRefine
OpenRefine (formerly GoogleRefine) is an open source data cleaning and tranformation tool. OpenRefine uses an interface that resembles a traditional spreadsheet while offering powerful database manipulation capabilities. While knowledge of GREL (Google Refine Expression Language) is useful, it is not required as many command lists exist that new users can draw on, like this example: Regex
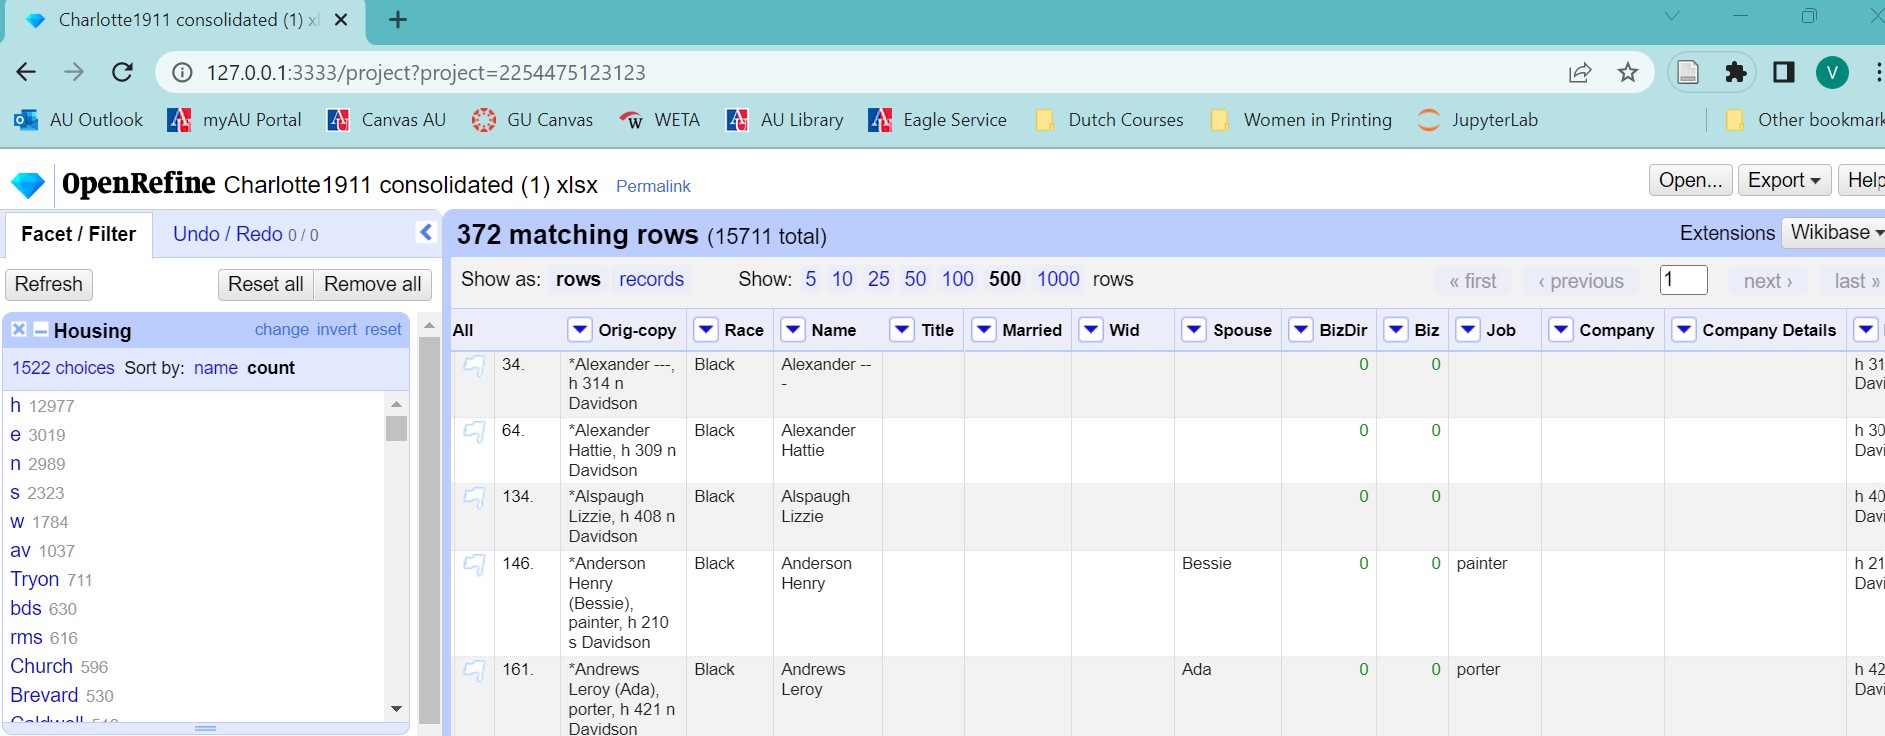
1.Using Faceting In order to determine the most populous streets in Charlotte in 1911, the housing column was faceted using word faceting, and then ranked by count to find the most frequently entered street names.
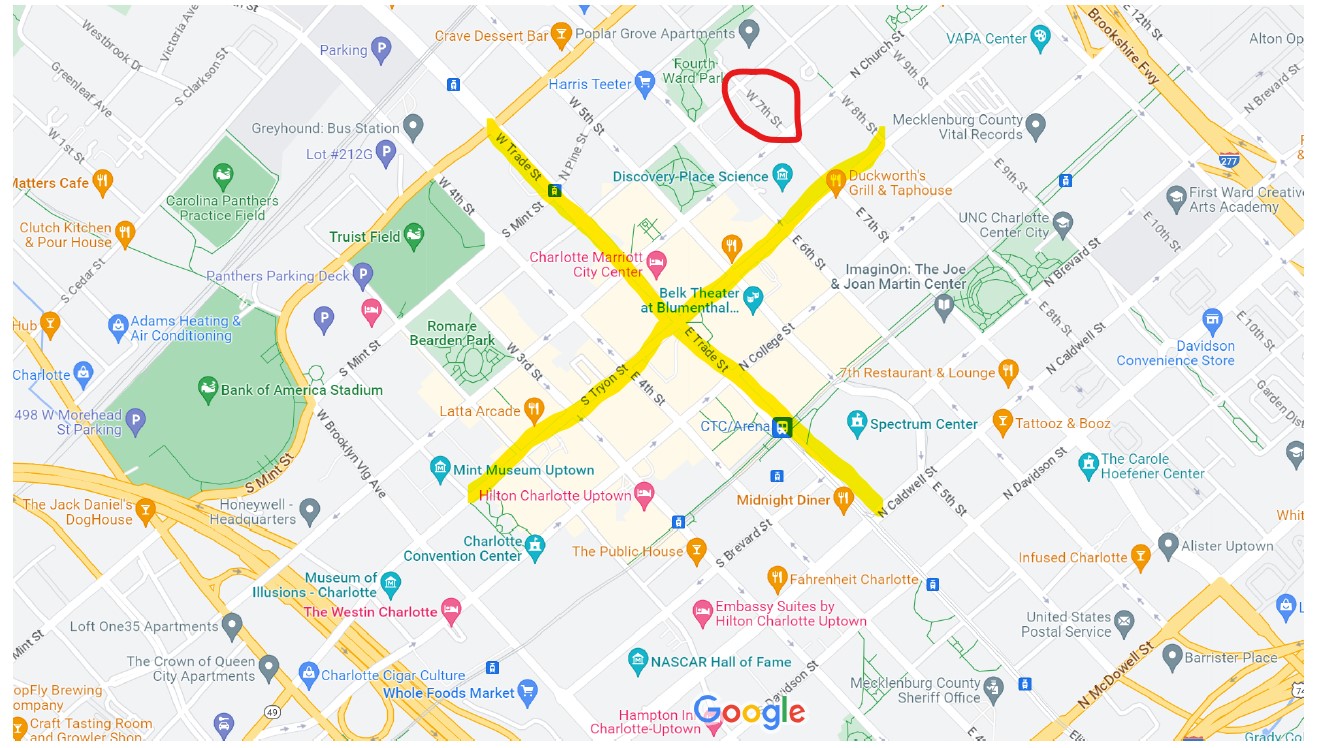
In 1911, Tryon St was the most frequently named street of residence for Charlotte. However, since Tryon St forms part of the main axis, it was not selected for this study. After Tryon St, 7th St was one of the most heavily populated street in the City Directory. Three other streets with large populations that were roughly the same distance from the center of the axis with roughly the same population numbers as 7th St were chosen for this study: Graham St, Davidson St, and 2nd St.
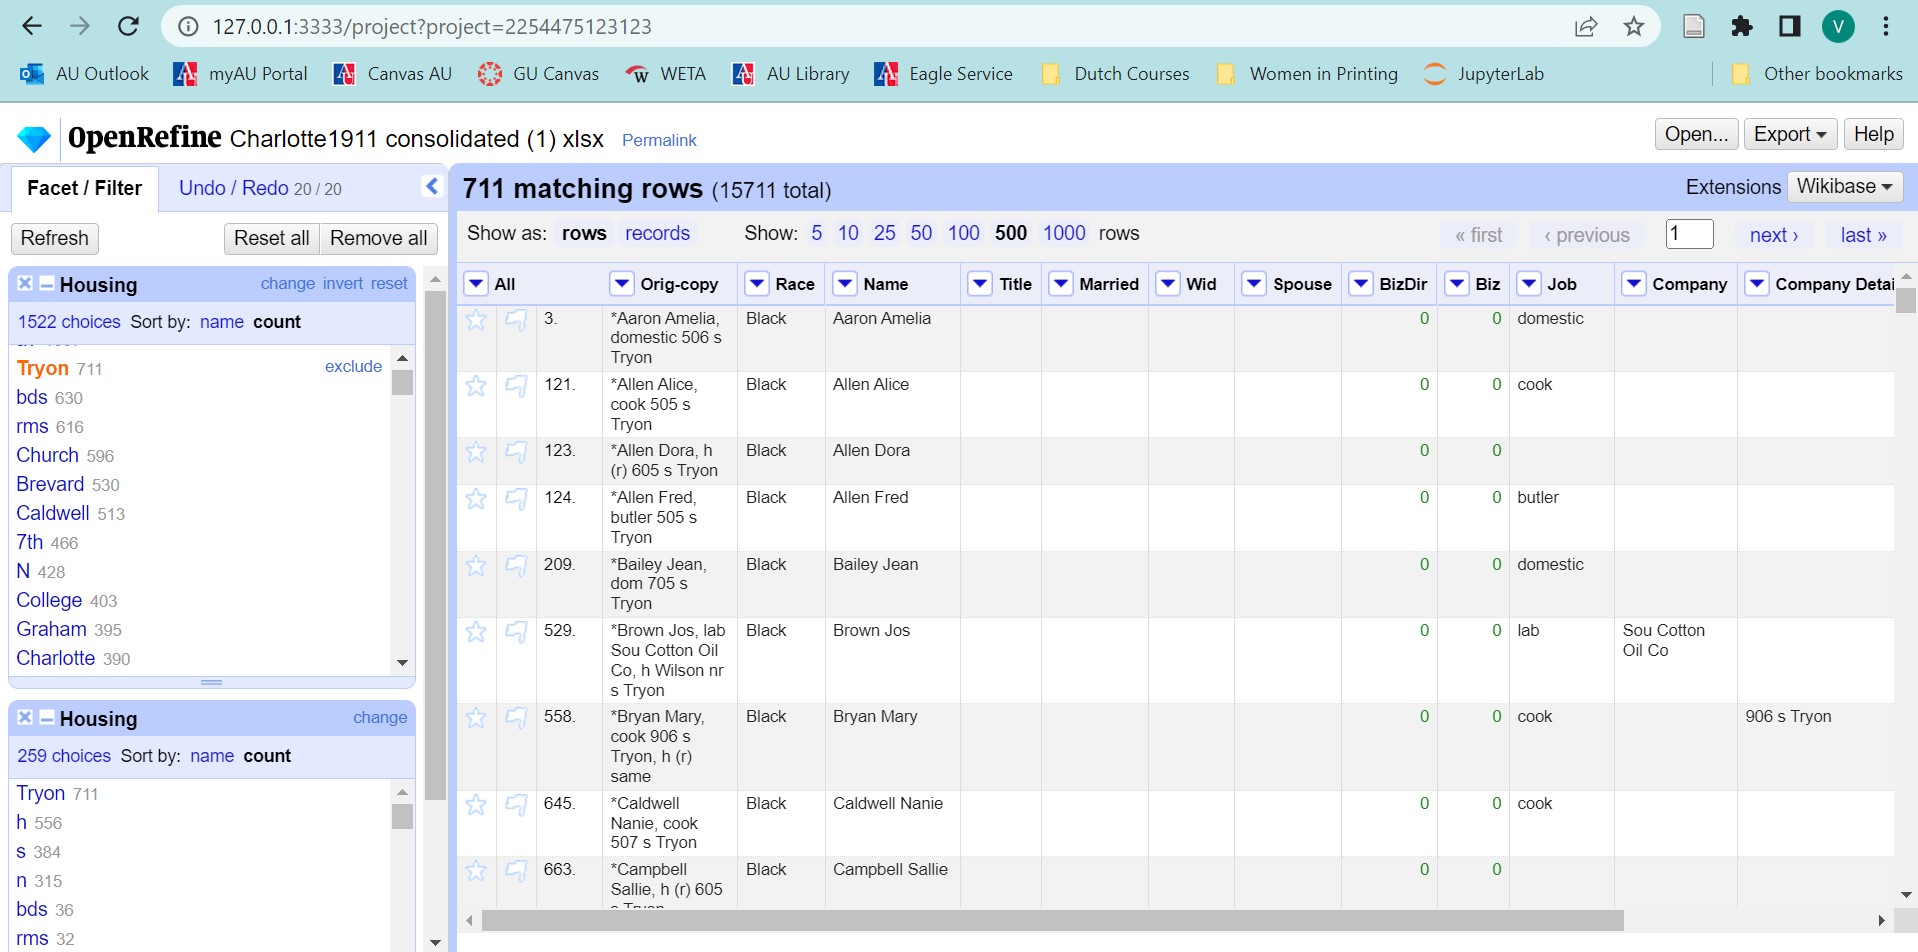
For each street, the facet showing the street name was selected, and then for those filtered results, a secondary word facet was added to the housing column to be able to select records on those streets by street direction (E/W, N/S).
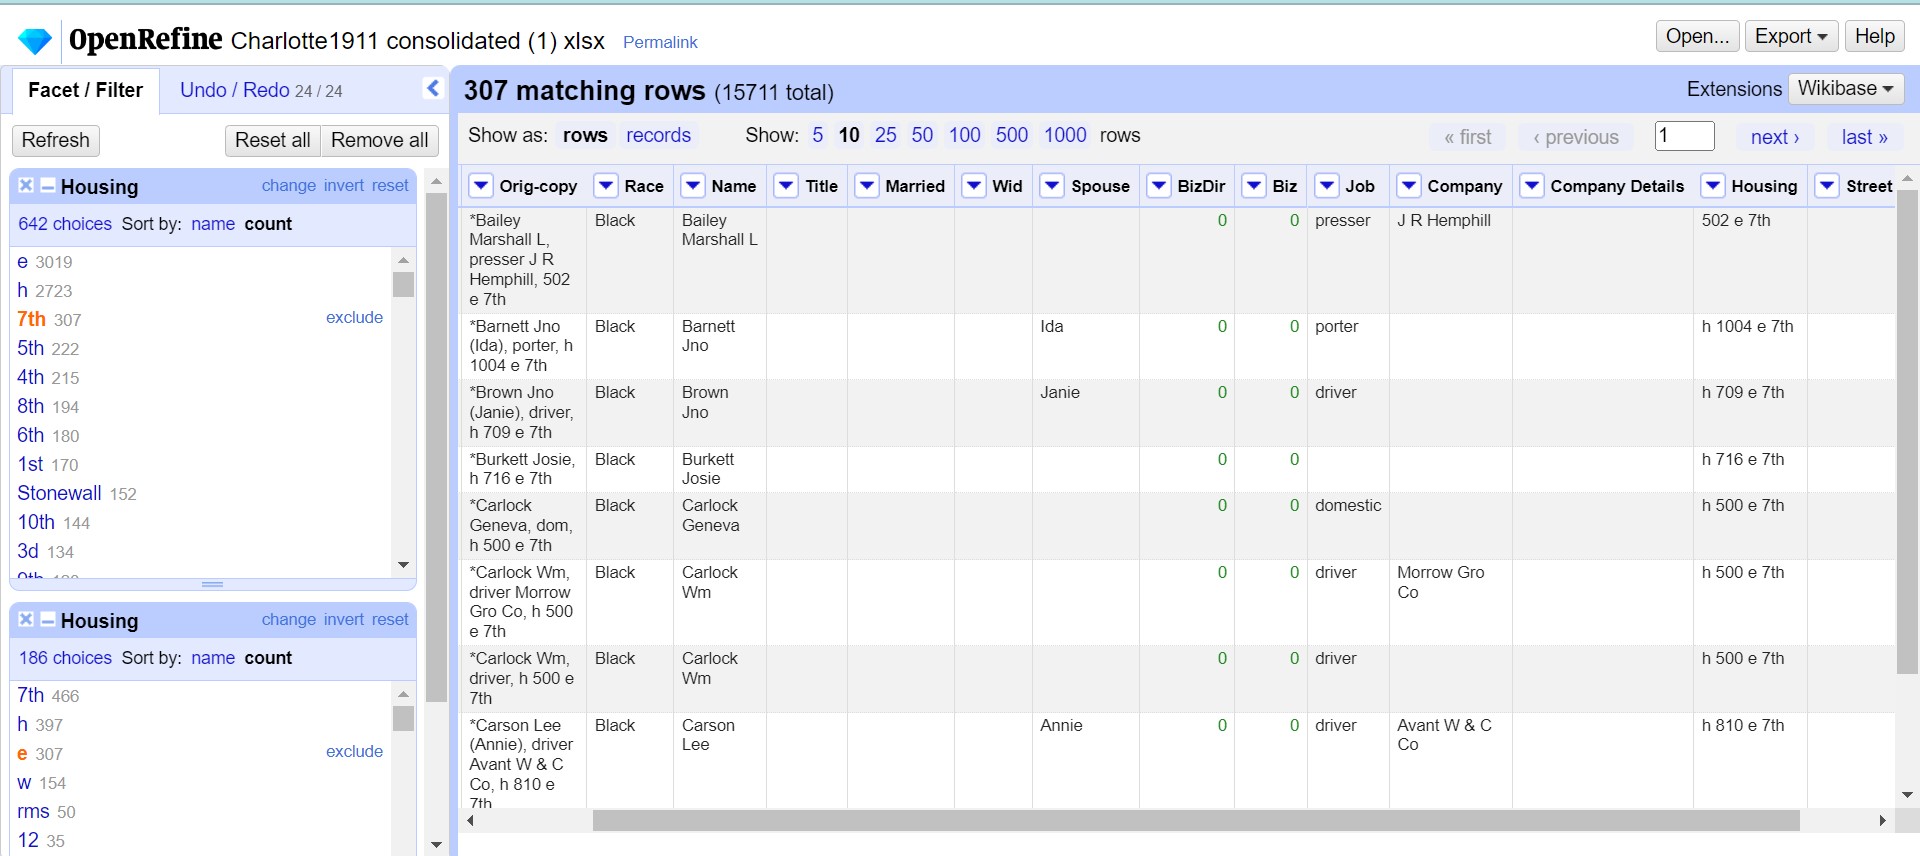
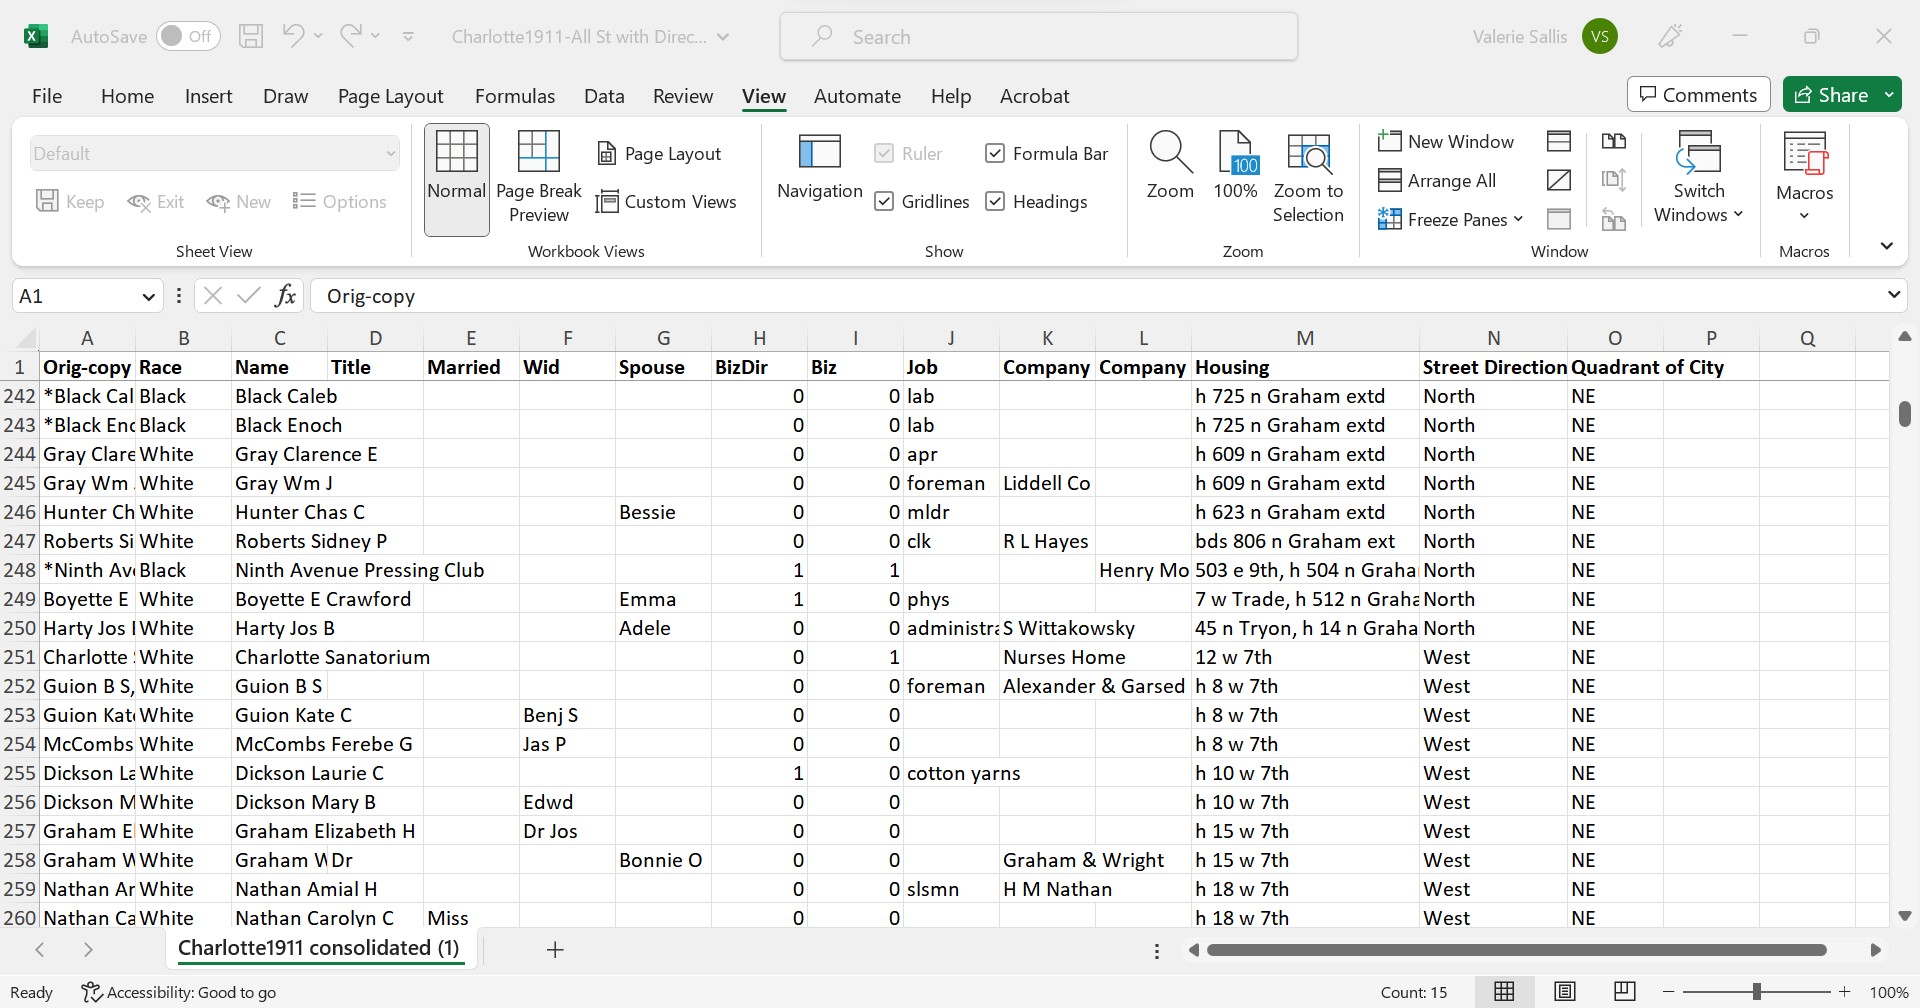
2.Adding a New Column. For each street, a new column was added for Street Direction that initally copied the value from the housing column.
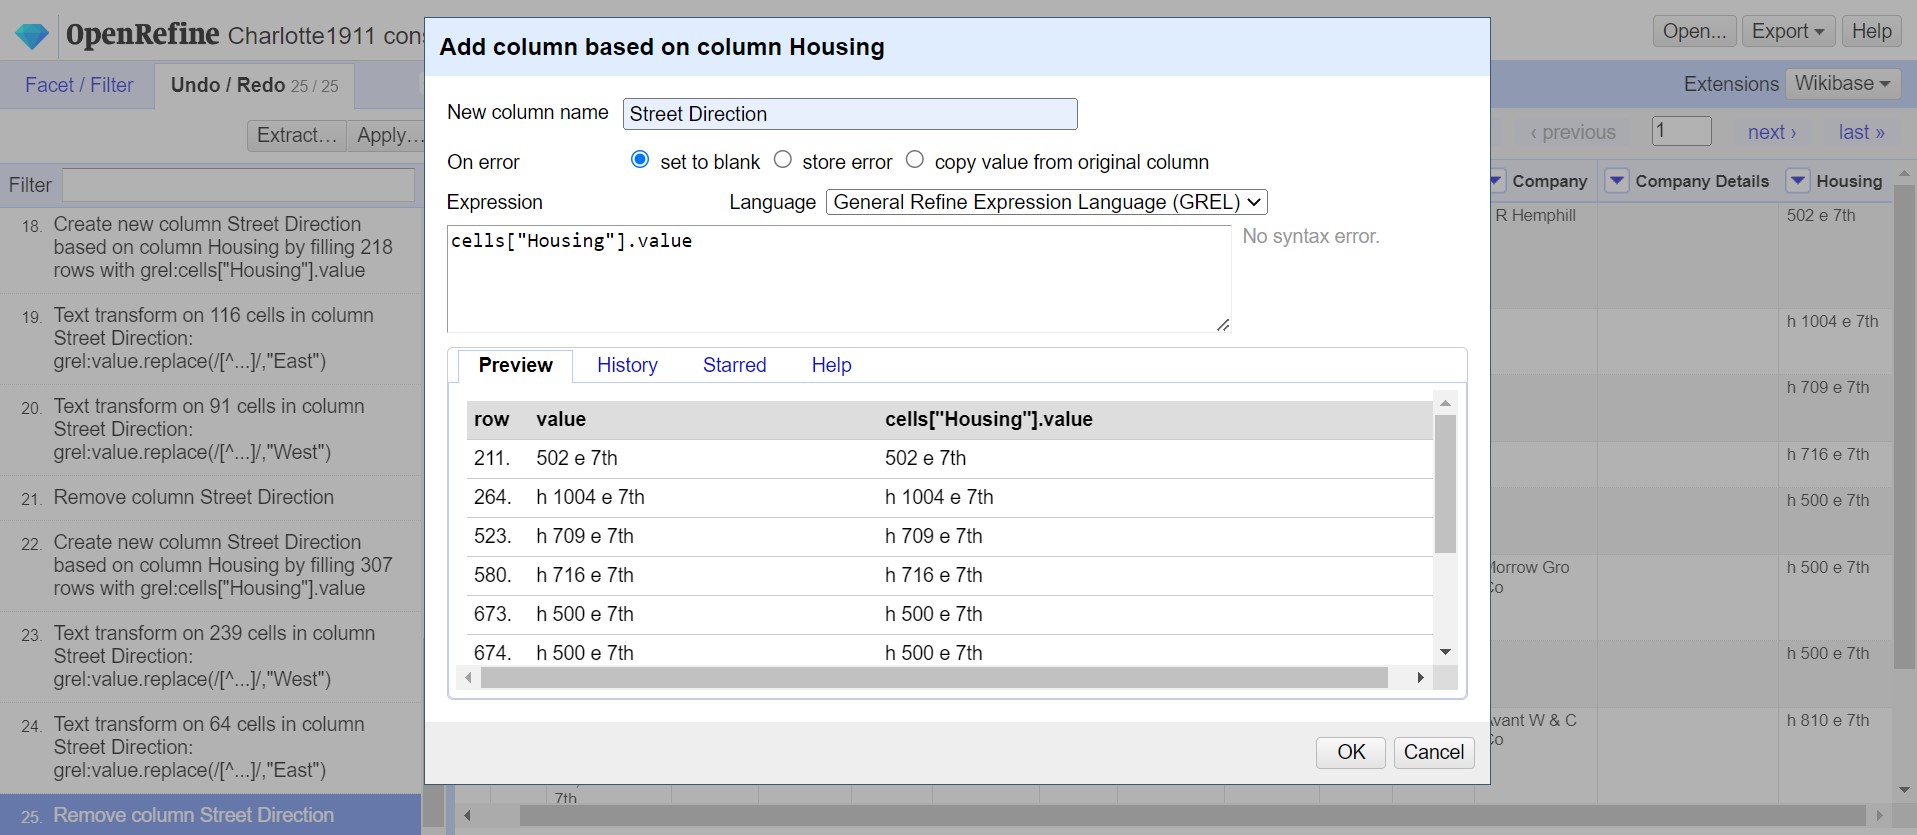
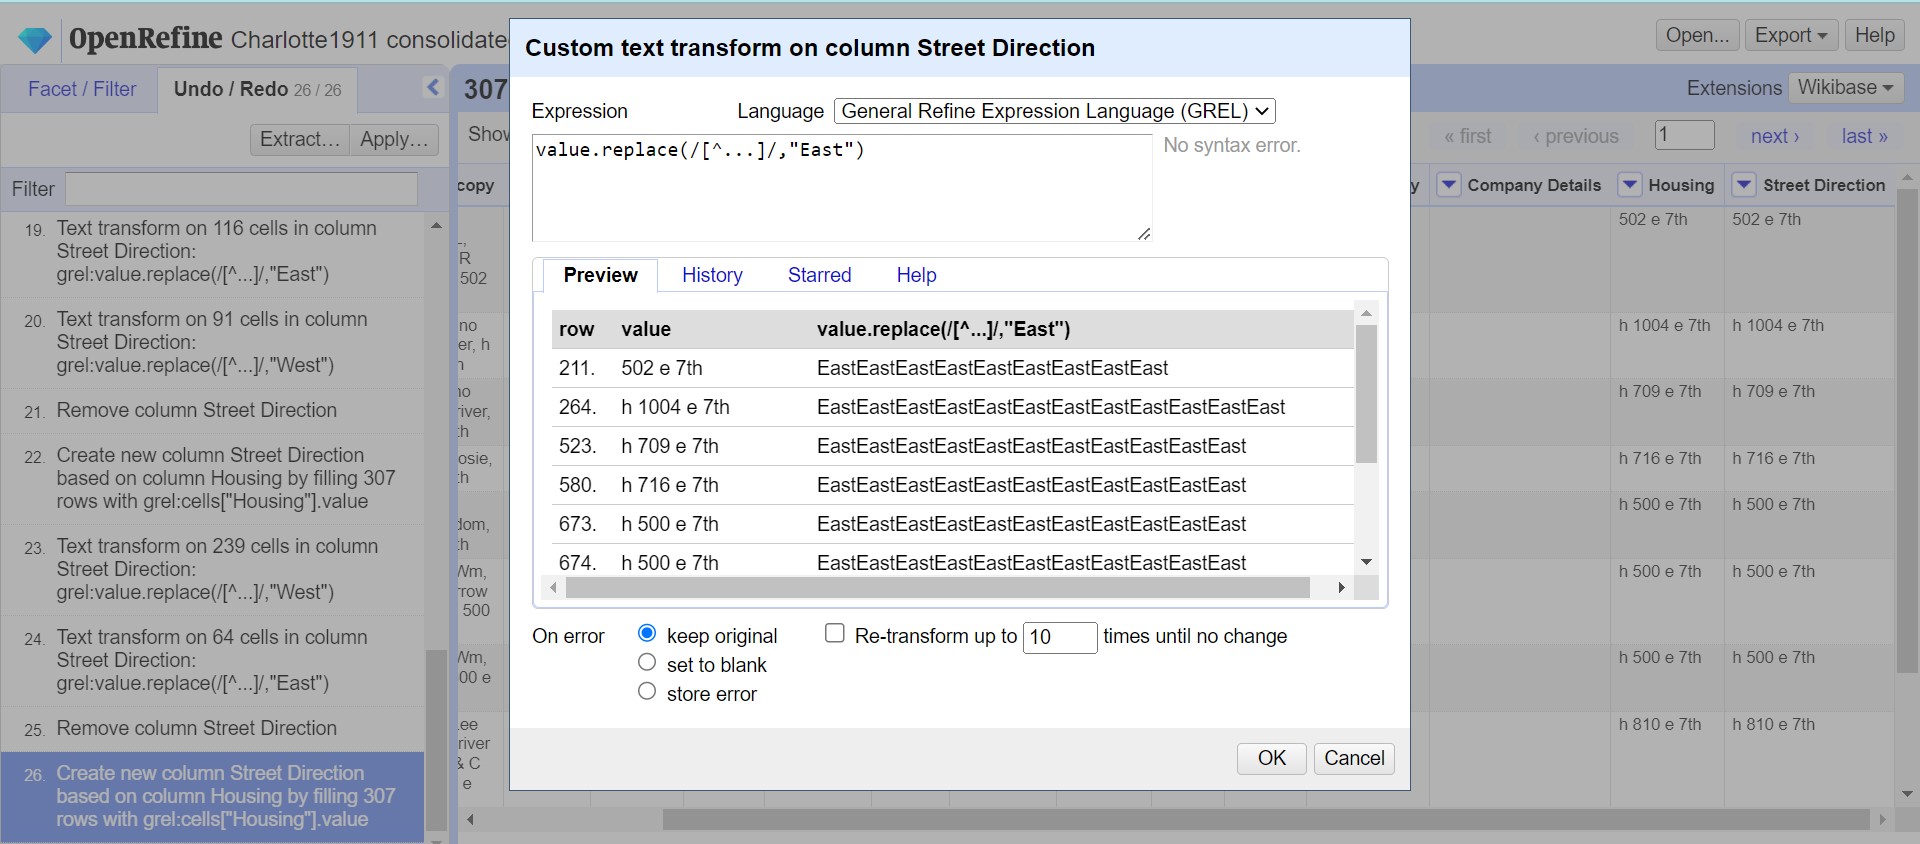
3.Transforming Cells
There are probably much more elegant ways to do this using GREL, but since the purpose of this project is to show methods accessible to beginners, a rather "brute force" but effective transformation was made that substituted the appropriate directional word for any characters in the new "Street Direction" column depending on what street direction facet was selected.
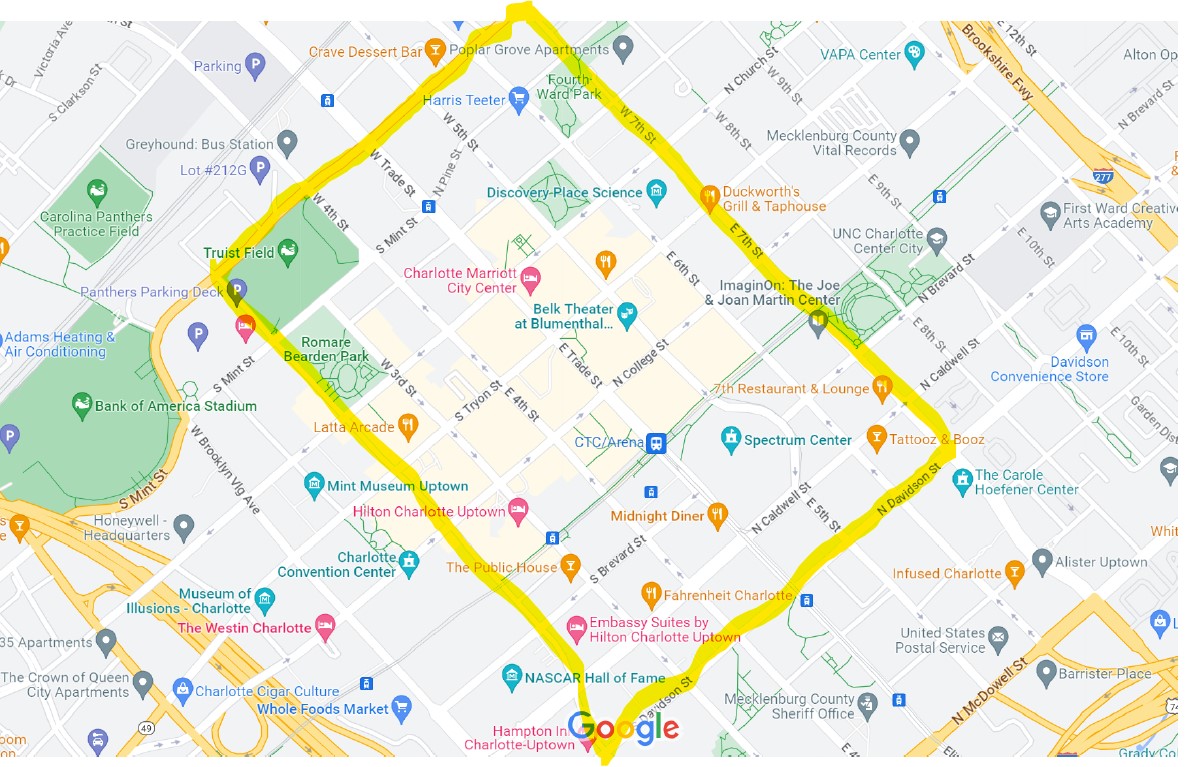
The resulting spreadsheets for each street were then exported to Excel. The excess words in the Street Direction column for each sheet were removed using bulk fill functions in Excel (dragging down a single value to fill below) and then a new column for City Quadrant was added to each sheet with the quadrant of the city determined by looking at the map of Charlotte based on the direction of that street (N,S,E,W), and finding whether that portion of the street was NE, NW, SE, or SW of the Tryon St and Trade St axis.
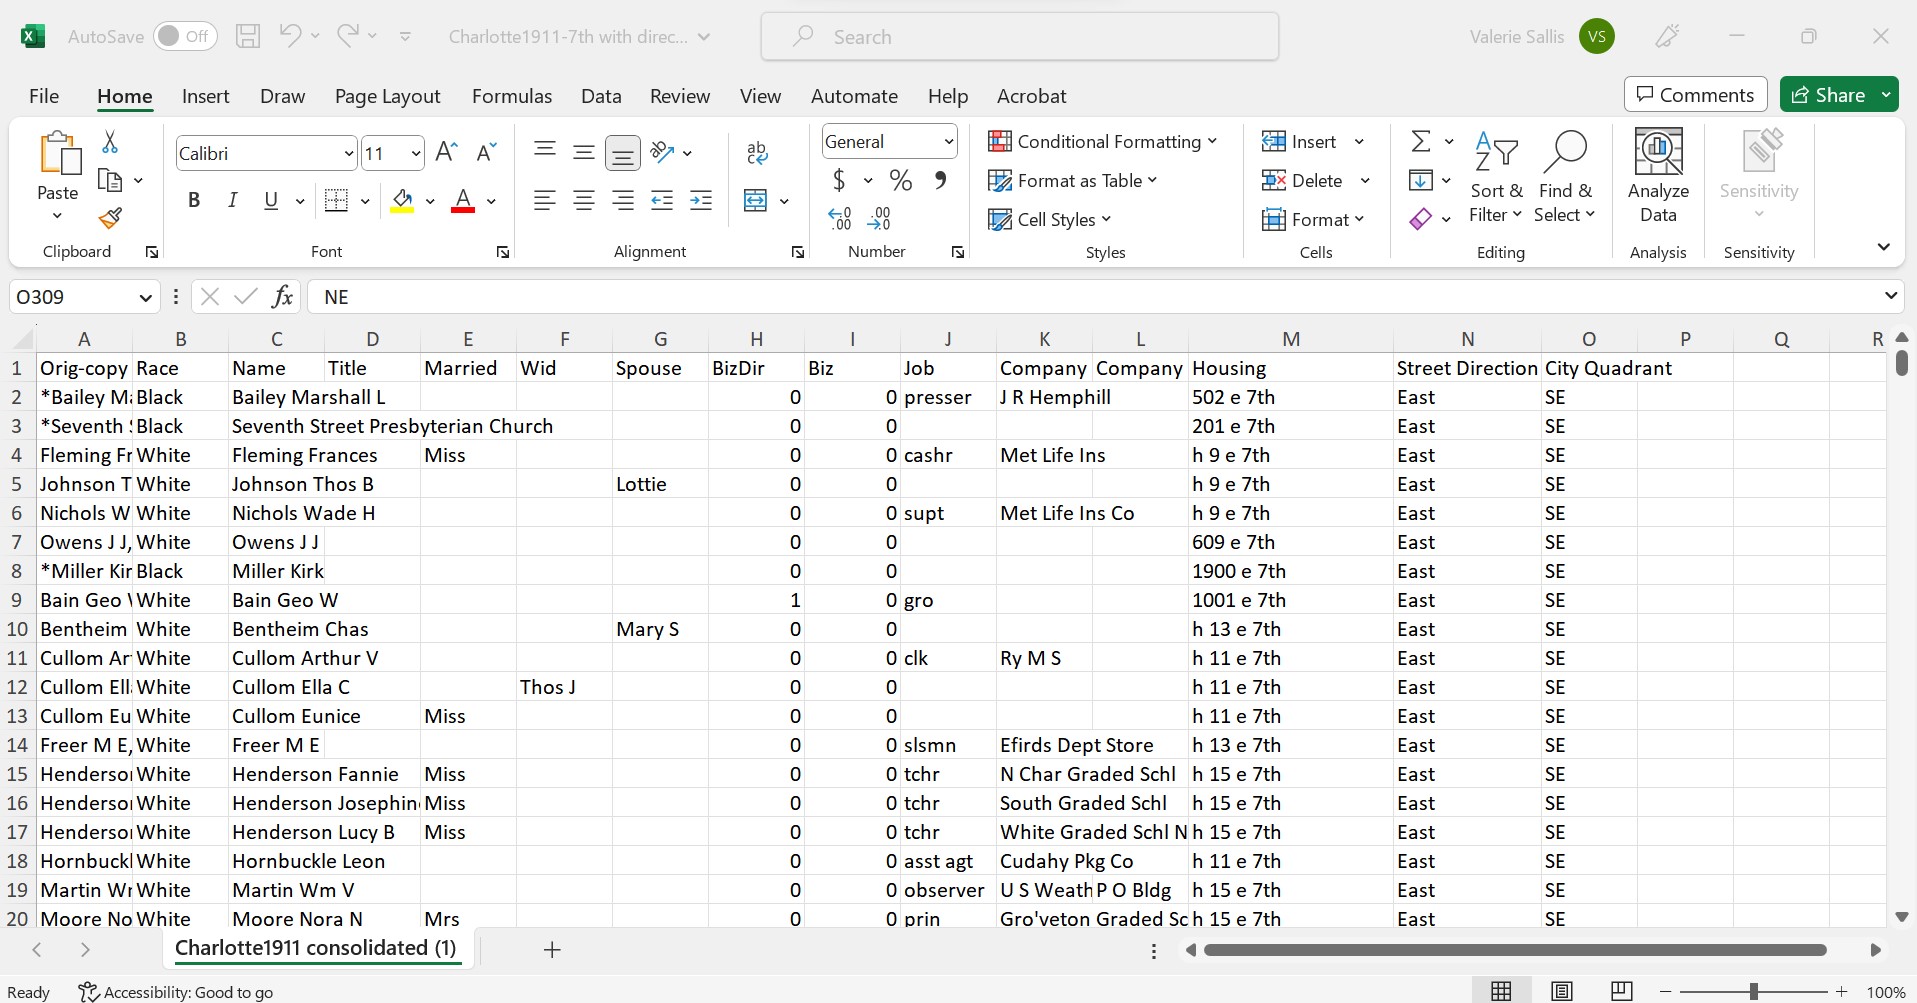
One spreadsheet was then created containing the data for all of the four streets. This master spreadsheet and the single sheet spreadsheets for 2nd and 7th Sts were used to create visualizations in Tableau, as will be seen in the next notebook.
JSON code for all the data manipulations performed in OpenRefine can be found here. JSON
Next: Visualization