Henry Morgenthau Jr., The International Monetary Fund, & Sentiments
by KH, HL, MN Group The File Cabinets
Data Overview, Telling Our Story
This story focuses on Henry Morgenthau’s mentions of the International Monetary Fund (IMF) leading up to the 1944 Bretton Woods Conference, as well as Russia's opposition to the fund. Using natural language processing (NLP) on the data set, we examined the sentiment toward Russia in regard to the IMF leading up to the agreement at Bretton Woods. The analysis centers on Volume 25 of the Morgenthau Press Conferences. Its information gives researchers valuable insight into the time right before the Bretton Woods Conference. (HL)
As WWII came to a close, world leaders began looking for ways to avoid another economic collapse and war. When 45 countries met at the Bretton Woods Conference, NH, delegates agreed on a framework for international economic cooperation (World Bank Group, 1944). Membership lessened when the war ended, and the Cold War began to take shape. The IMF is an early example of the United States and Russia’s contrasting economic interests and struggles over global influence. When the IMF Articles of Agreement was officially signed in December of 1945, 29 of the original 45 countries signed, displaying global division during the Cold War (International Monetary Fund, 2022). Henry Morgenthau Jr., the United States Secretary of the Treasury, played a major role in developing the plan and getting other countries on board. His push for monetary support to Allied countries throughout the war swayed counties to sign the agreement at Bretton Woods (Truman, 1945). In the Secretary’s press conferences leading up to the conference at Bretton Woods, Russia’s participation in the new global economic system was often questioned. (HL)
Dataset Exploration related to Scale and Levels within Collection
Our group chose to zoom in on one volume of the Morgenthau Press Conferences: Volume 25. It spans from November 4, 1943, to June 29, 1944, and contains valuable information about the early development of the IMF. A large portion of the press conferences discussed what countries were in support of the economic stabilization plan, logistical concerns such as where the conference was taking place, and what role Morgenthau would play in the plan. Also included is Morgenthau's statement before Congress where he discusses the Special Committee on Postwar Economic Policy and Planning and President Roosevelt’s letter appointing Morgenthau as the American representative at Bretton Woods.
That information gives researchers valuable insight into the time right before the Bretton Woods Conference, as well as how Morgenthau interacted with the press. Our first step in engaging with the dataset was identifying terms relating to Russia and the IMF and understanding Morgenthau’s relationship with the press. (HL)
Data Cleaning and Preparation
After selecting our volume, we separated the pages into three equal parts for the cleanup process. We decided that the index wasn’t necessary for what we were doing, so subtracting those pages, each person worked with roughly 95 pages. The cleanup process required a lot of trial and error as the document we were working with could not easily be converted to searchable text. We tried several different software and online resources before finding a process that worked. First, we converted the PDF into JPEG image files using Smallpdf. From there, we could convert those files into machine-readable text using PrePost SEO. PrePost SEO’s free version allows the user to convert three pages at a time, which is then output into a textbox. We copied the text into separate Google Docs files for further cleanup. The conversions weren’t perfect, so we manually corrected problems we found, skimming for spelling and other noticeable errors. While the best option we could find, the process was still not as automated as we would have liked; however, we found it better than hand-transcribing the entire selection.
In an effort to extract the information relevant to our topic, we used Google Docs' available features to search for pertinent keywords (e.g., Russia, Russian(s), Soviet Union, etc.). Any information that we found to be relevant was then placed in a shared Google Sheets file that had been sorted into categories: name, date, type, question, answer, and respondent. (MN)
To prepare for further analysis, we aggregated each group member’s data into one Google Sheet and exported it as a comma-separated values (CSV) file. After noticing discrepancies in our transcription methodology, including name and date formatting, we decided that a method for standardizing our data collection formats was necessary, which we achieved using OpenRefine’s text facet and sort-by-date filters. Once filtering was complete, the data were output as a CSV file for use in the next stage of our project: computation and transformation. (KH)
Figure 1. A Process Diagram of the Data Cleanup and Preparation.

Modeling: Computation and Transformation
Throughout our data collection, each contributor noted various instances of a shift in attitude toward Russia’s involvement in the IMF, reflected in both the questions and answers. After discussing the possibilities of why that shift occurred, our group decided to investigate further by modeling our dataset using sentiment analysis and an interactive timeline. To prepare for sentiment analysis, we installed Python packages using Anaconda (a Python package manager) including:
- Natural Language Toolkit (NLTK) – Python package for NLP: used to download files required for VADER sentiment analysis (Hutto & Gilbert 2014)
- Pandas - a Python data analysis library
- Matplotlib - a Python plotting library
We uploaded our previously exported CSV file from OpenRefine into a Jupyter notebook as a Pandas data frame, allowing us to manipulate rows and columns to run VADER sentiment analysis functions (Figure 2). We ran VADER functions on each question and answer and assigned each row a score representing its relative amount of positive and negative sentiment. The scores were between 1.0 and -1.0. 1.0 would mean all the words in a statement are positive, -1.0 would mean all the words in a statement are negative, while a 0 would mean the statement is neutral or contains an equal number of positive and negative words.
Figure 2. Working View of local Jupyter Notebook.

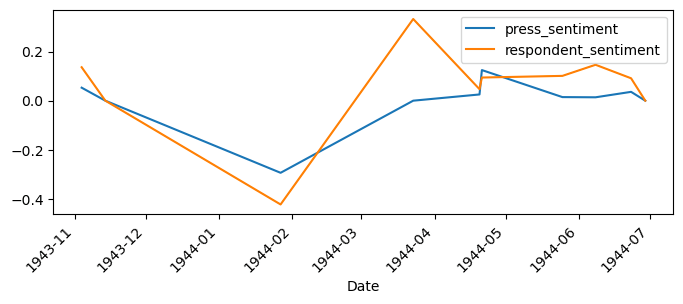
Then, using Pandas, we took the mean of all the scores for each date so that each press conference would have a single score for the press sentiment and a single score for the speaker's sentiment. Finally, we plotted the scores so that one can see how the sentiment of both parties changed over time, providing a consistent way to examine how attitudes about Russia changed over time (Figure 3). We also exported both the aggregated and unaggregated data as CSVs so we could do further analysis with other programs. (KH)
Figure 3. A Diagram of the Sentiment Analysis.

Modeling: Visualization
A line chart was chosen to visualize the sentiment analysis to showcase the trends of both the positive and negative sentiment scores of the respondents and press throughout Volume 25 (November 1943 to July 1944). We used Pandas’ interface to Matplotlib to generate the time series line chart. Our visualization in Figure 4 shows interesting trends, starting with an initial decline of sentiment in both respondent and press scores, followed by a slightly positive respondent sentiment and a generally neutral press sentiment. Visualization of this kind of trend provides an overview of the sentiment of discussions pertaining to Russia and the IMF during the period. (KH)
Figure 4. A Sentiment Analysis Line Chart.

Interactive Timeline
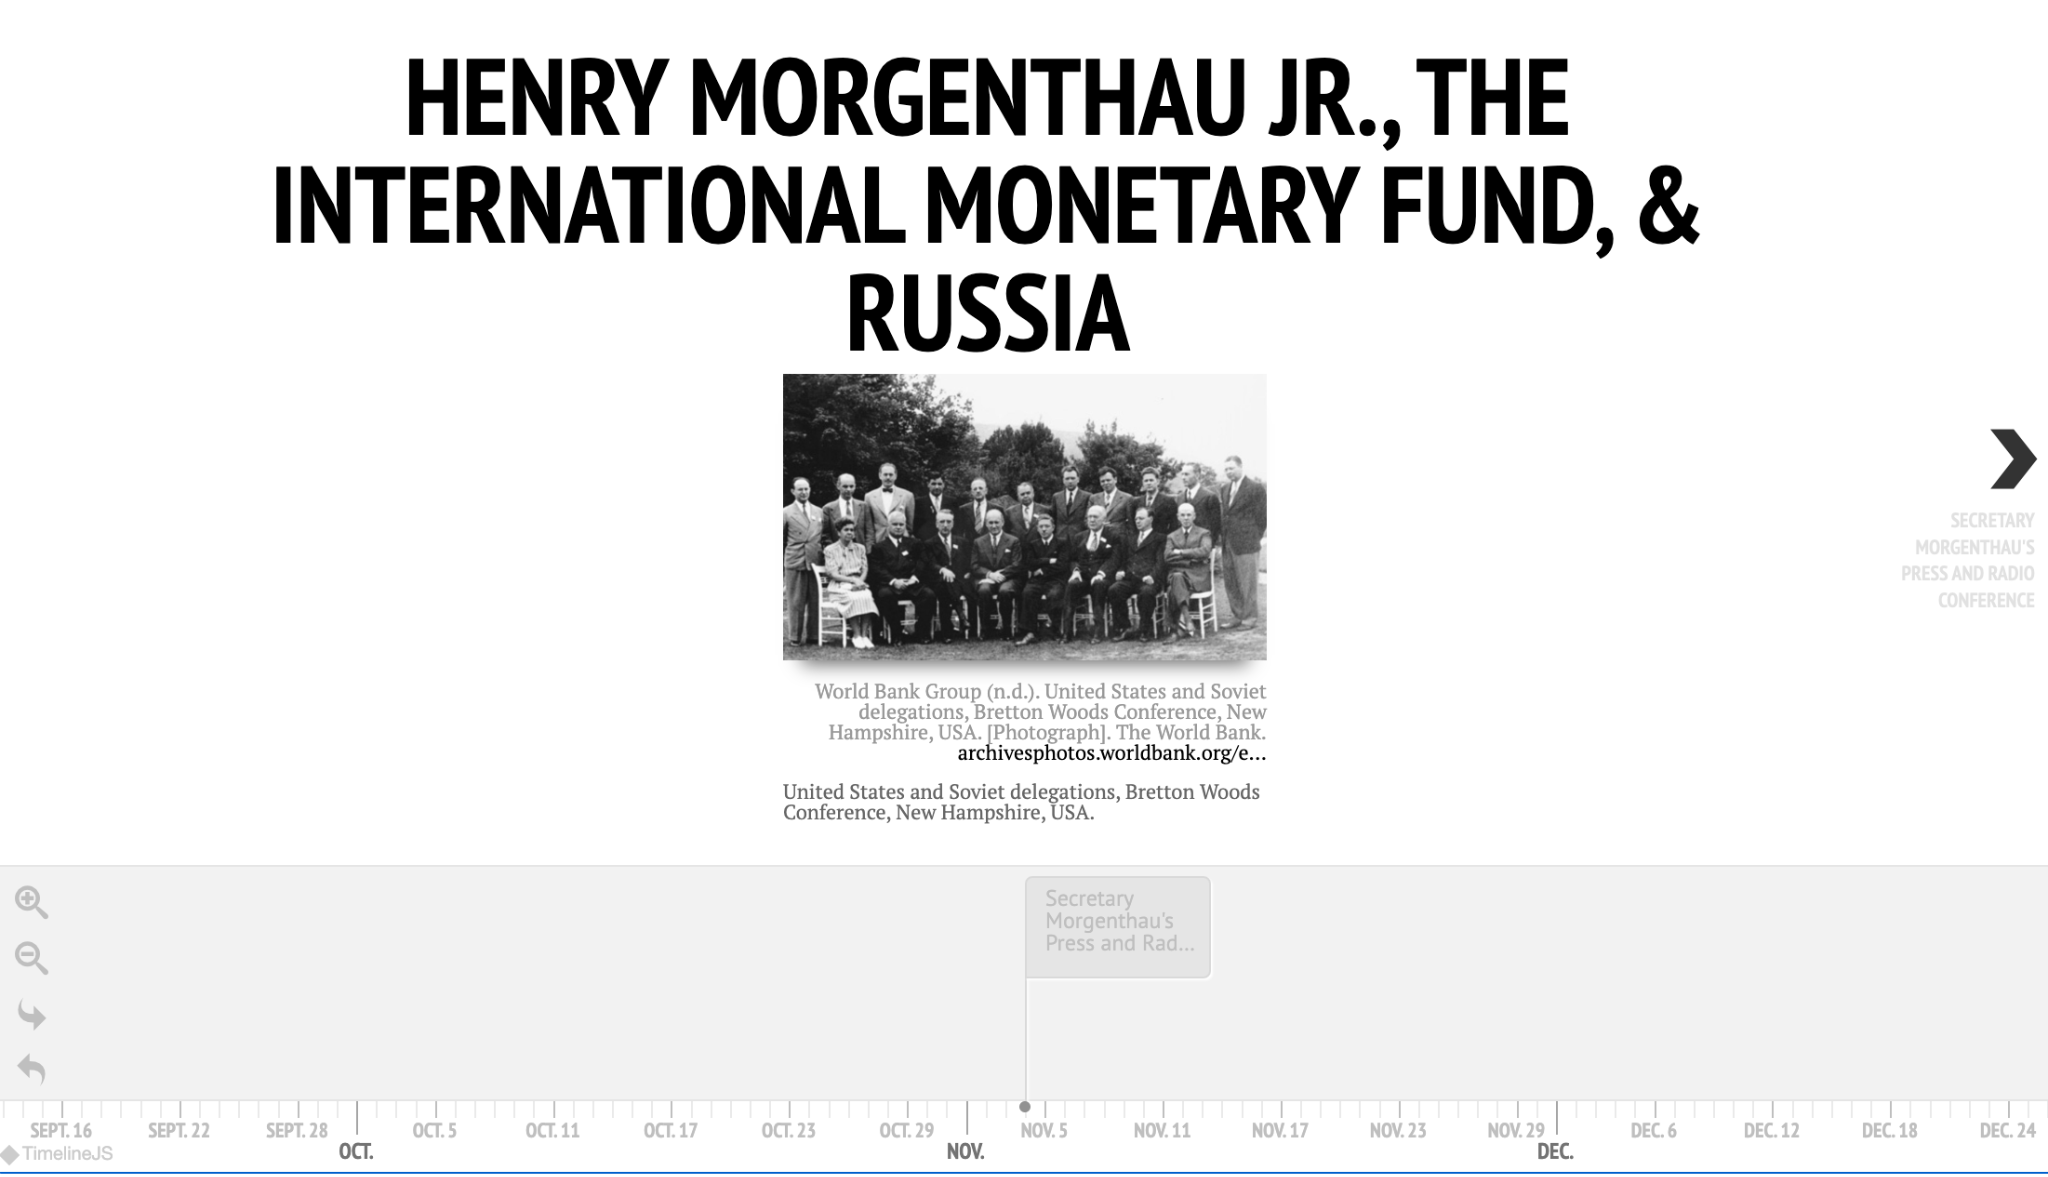
Another computational model we chose to complement the sentiment chart with was an interactive timeline. Over the scope of Volume 25, there were several separate occasions where Russia was mentioned relative to the IMF. We thought a timeline would be the best way to show these dates. To accomplish this, we used the TimelineJS tool from Knight Lab. Following the instructions on the site, we utilized Google Sheets to input the dates and additional text that was then turned into our interactive timeline: the name of the press conference as given in the volume, the date of the press conference, and a brief explanation of what was said in relation to Russia.
As stated before, the timeline shows the points in time when Morgenthau spoke about Russia to the press. The points correspond to the dates seen in our sentiment chart (see Figure 4). The intended goal of providing this timeline is to give context and, hopefully, reveal potential reasonings behind the sentiments found in Figure 5. To access the entire interactive timeline see https://cdn.knightlab.com/libs/timeline3/latest/embed/index.html?source=1piEcS0lkMRVrVYJxOhvTD8UYCNcbP7laK7zzlVKDzHQ&font=Default&lang=en&initial_zoom=2&height=650 . (MN)
Figure 5. Knight Lab TimelineJS3 screenshot of event page for January 27, 1944.
In conjunction, the visualizations give a multidimensional, high-level sense of the importance of the January 27, 1944 press conference as a depth marker of negative language about obstacles to Bretton Woods participation. (MN)

Ethics and Values Considerations
Although the sentiment analysis is arguably a more objective way of assigning positive or negative scores to language, it is naïve compared to a human understanding of the text. It could lead to perceived inaccuracies where a human reader would disagree with the sentiment analysis results. We note that such issues would still apply to a human ranking of sentences; however, it is vital to consider how consistency in software does not equate to unbiased software.
When presenting this project, one of our peers noted the meaning of words may have changed from when they were spoken in the 1940s to when VADER was created in 2014 (Hutto & Gilbert, 2014). More work is needed to determine how accurate VADER’s scores are for historical texts.
Other considerations include the limitations of the original data source, the Morgenthau Press Conferences, and the possible biases that may influence the overall sentiment analysis results. Biases may exist due to the moderated nature of the press conferences and conflicts of interest by the respondents to answer accurately while maintaining American diplomatic goals. In other words, the reader should recognize that this is the version of events that Secretary Morgenthau wanted the press to hear. (KH)
Summary and Suggestions
Through our manipulation and visualization, researchers (at the FDR Library) could achieve a better understanding of both Secretary Morgenthau and the public’s sentiments toward Russia at the close of World War II. Using natural language software has the potential to expand other collections in a way that is valuable to library users. Archivists could use similar methods on other topics and other press conferences found in their collections. For example, archivists could collect data from press conferences that took place before the war and manipulate the data to see how sentiments toward Germany shifted.
Automated data extraction from PDF files, even when OCR works, is still a challenging problem. Similarly we found that OpenRefine is more useful for data that is already organized and readable, and for combining independently-created datasets, so it was not much a part of our project. Most manipulations were easier with Pandas (and crowdsourced cues and pointers) than OpenRefine. NLTK and VADER are most useful in analyzing short strings of text, which could limit its usage on other parts of the collection. Our method is not perfect, but with more practice on other collections, it is potentially a valuable tool for archivists, historians, and librarians, as it allows for tracking patterns of natural language in a dataset so large. (HL)
References
- Hutto, C.J. & Gilbert, E.E. (2014). VADER: A parsimonious rule-based model for sentiment analysis of social media text. Eighth International Conference on Weblogs and Social Media (ICWSM-14). Ann Arbor, MI. https://doi.org/10.1609/icwsm.v8i1.14550
- International Monetary Fund. (2022). “About the IMF: History: Cooperation and reconstruction (1944-71).” Retrieved October 19, 2022 from https://www.imf.org/external/about/histcoop.htm
- Truman, H.S. (1945). “Citation accompanying the Medal for Merit awarded to Henry Morgenthau.” The American Presidency Project. Retrieved October 19, 2022 from https://www.presidency.ucsb.edu/documents/citation-accompanying-the-medal-for-merit-awarded-henry-morgenthau
- World Bank Group (1944). “United States and Soviet delegations, Bretton Woods Conference, New Hampshire, USA” [Photograph]. The World Bank. https://archivesphotos.worldbank.org/en/about/archives/photo-gallery/photo-gallery-details.5911387