An Analysis of the Subject Indexing in 1936 by Treasury Librarian Isabella Diamond: Financial Matters in Letters C to F
by KD, MM, HS Group Hedy Lamarr
Data Overview, Telling Our Story
Our team completed a data modeling exploration within Series 1 of the Morgenthau Press Conferences collection, published by the Franklin D. Roosevelt Presidential Library and Museum. While Series 2 comprises a 27-volume recollection of the significant events of the Roosevelt Presidency, Series 1 contains an index of seven alphabetically arranged sections, providing the user with document-level access to various subjects. We specifically analyzed the second section’s 400-page index card file of alphabetical subjects from “Civilian Defense Office” to “Financing, Government” (HS, KD). Our guest lecturer’s article (Carter, Gondek, Underwood, Randby, and Marciano 2022) states that Isabella Diamond indexed Morgenthau’s press conferences in 1936. Working full-time as an experienced librarian, Diamond – and Morgenthau’s primary personal secretary Henrietta Klotz – significantly “influenced” the priority topics pursued by Morgenthau and the directions which would come to define Roosevelt’s presidential legacy (Gondek 2021).
Dataset Exploration related to Scale and Levels within Collection
To explore the correlations between finance within the government and currency exchange through keywords such as “currency,” “money,” “coin,” “silver,” “fiscal,” and “finance,” the group attempted to run an OCR output of the original PDF from the FDR Library, using iOS Preview (available on all Apple computers). Diamond both created a custom schema in 1936 and developed the microfilm in the 1940s for the set of press conferences, the contents of which vary and are dated from 1933 to 1945 in our portion (HS, KD). In an instance of good reproducibility with Carter’s article, it became apparent that the files digitized in 2014 still were minimally optimized for OCR, producing now mostly garbled and incomplete text. OCR was applied to the original document via DocDrop (via Convertio by KD) with the instructions we provide below.
Data Cleaning and Preparation
To OCR a PDF:
- Open http://docdrop.org/ocr
- Drag a file onto the DocDrop page or click the DocDrop page and select the file from your computer.
- Select the "Redo OCR" button at the bottom to enhance the current OCR.
- Download the resulting PDF.
The new OCR PDF was then uploaded to the PDF to CSV converter on the Convertio website. After applying the conversion, the CSV was downloaded and ready to be uploaded into OpenRefine for data cleanup.
When the dataset from the CSV file was initially imported into OpenRefine, each row of text from every single card was added as a separate row, with the inclusion of blank rows, as shown in Figure 1.
To clean up the data, the corresponding rows for each card were linked together to represent a single record. The subject heading of each card was split into a separate column titled “Headings.” The contents of each card were kept in a second column titled “Original Data,” and the dates were split into a third column titled “Date,” as shown in Figure 2.


Below are the steps taken in OpenRefine.
To Get the Headings Column:
- Load data into OpenRefine, and click the option "Column names (comma separated)."
- Column 1 > Edit cells > Common transformations > Trim leading and trailing whitespace and collapse consecutive whitespace.
- Go through each row, compare with the original card and manually star rows with the headings. Clean and correct as necessary.
- Click the arrow next to All > Facet > Facet by Star.
- Under Column 1 > Edit column > Add column based on this column. Title this “Headings.”
- Clear the facet and move the Headings column to the left: Heading > Edit columns > Move column left.
- Facet by blank/null, and select TRUE in the left menu.
- All > edit rows > remove matching rows. Then clear the facet.
- Click records. The headings column will now map to the rows below it as records.
- Rename Column 1 to “Original Data.”
Source: https://stackoverflow.com/questions/46489840/openrefine-transpose-rows-into-columns-based-on-text
To Split Other Data Into Columns:
- Original Data > Edit column > Add column based on this column.
- It would help if you used some regular expression (regex) code to pull what you want. To get a date in the format xx/xx/xx for instance: "value.find(/[0-9]?[0-9]/[0-9]?[0-9]/[0-9][0-9]/)[0]". Name the column "Date" and create.
- If you want to look for a word or phrase and similarly pull that into a column for analytics, you can use this code in the same way as above: "value. find(/_____/)[0]" (the underscores are where your phrase goes).
Source: https://groups.google.com/g/openrefine/c/ZjU9vt0BWkc
After this point, the dataset was ready to be exported as a CSV to be used for creating a visualization in Microsoft Excel. (KD) Excel Chart Instructions:
- Load the CSV into Excel, and filter so that only the dates are shown.
- Copy these dates to another sheet and sort them so that they are all in chronological order (you may need to correct some dates that were mistakenly set for the 2000s, e.g., 2041 rather than 1941).
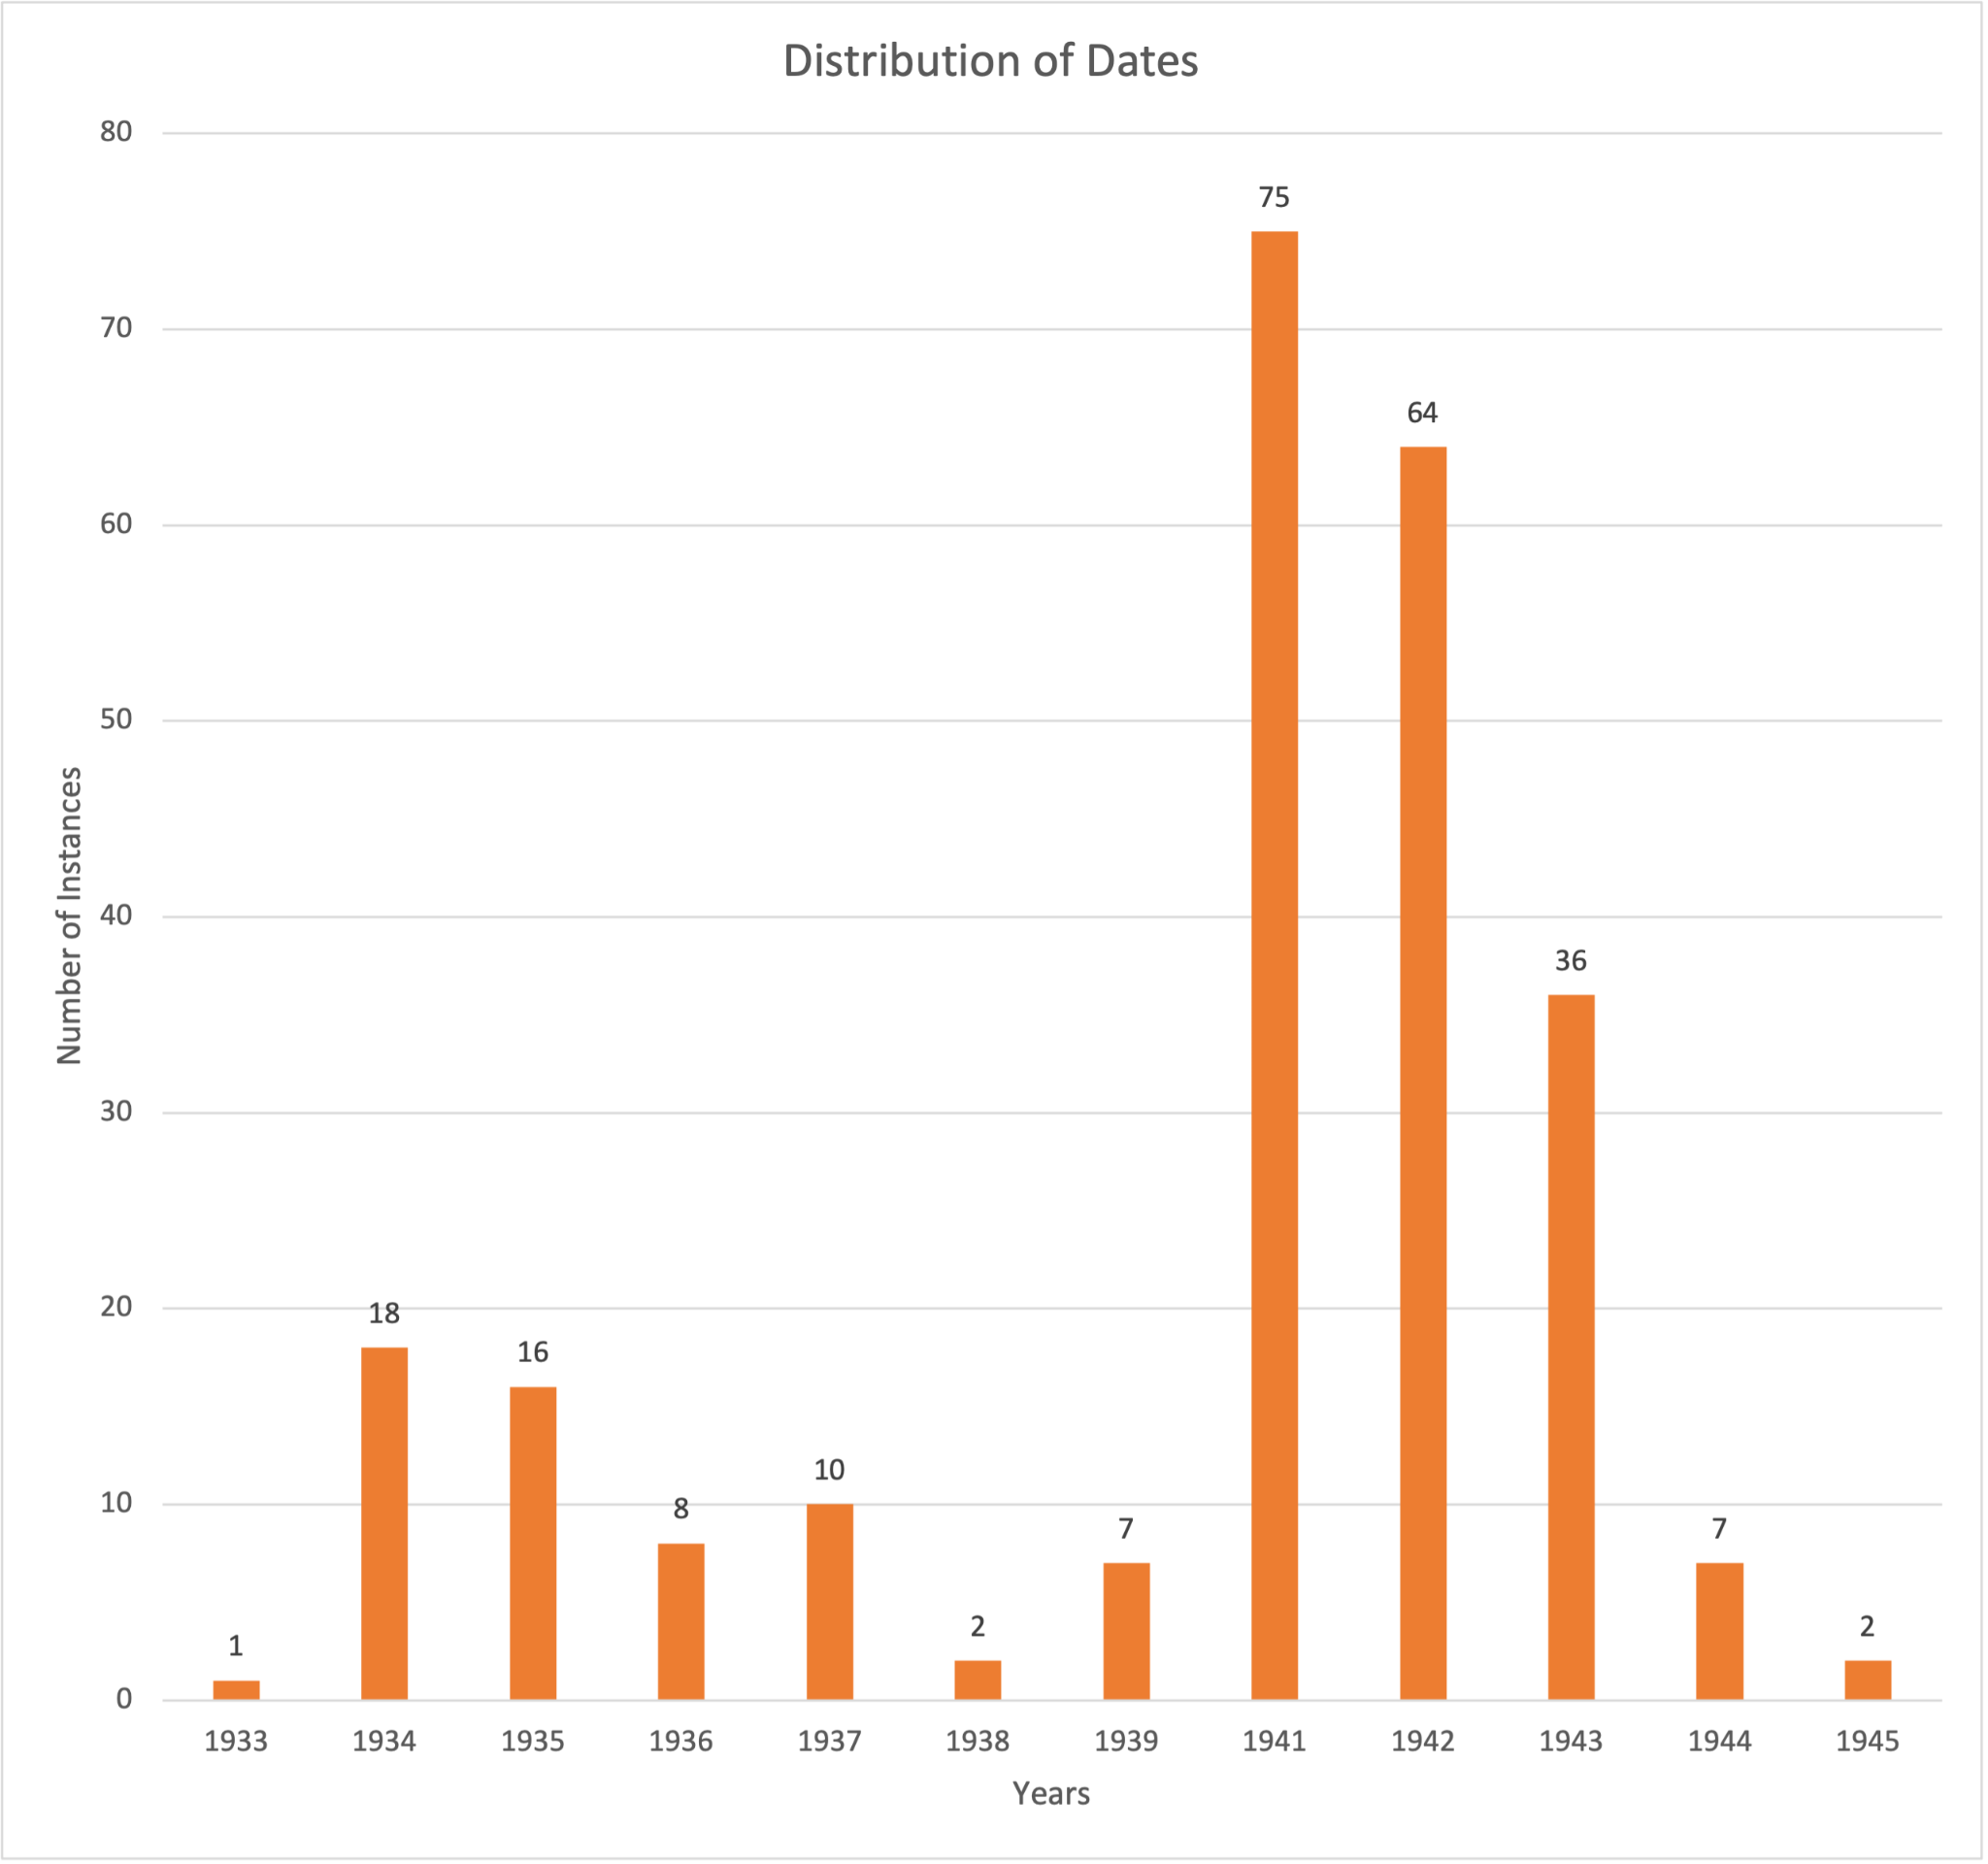
- Manually populate a new column with the number of instances of each MONTH in the first row and then delete the copies, e.g., for these dates, 2/1/41, 2/3/41, and 2/28/41, delete the bottom two and in the column next to the topmost have a 3. The end product should have only one of each MONTH, with the next column having the number of instances of each date in the original dataset. (Cutting the data by month is cleaner than for each day; alternatively, you could do it by year).
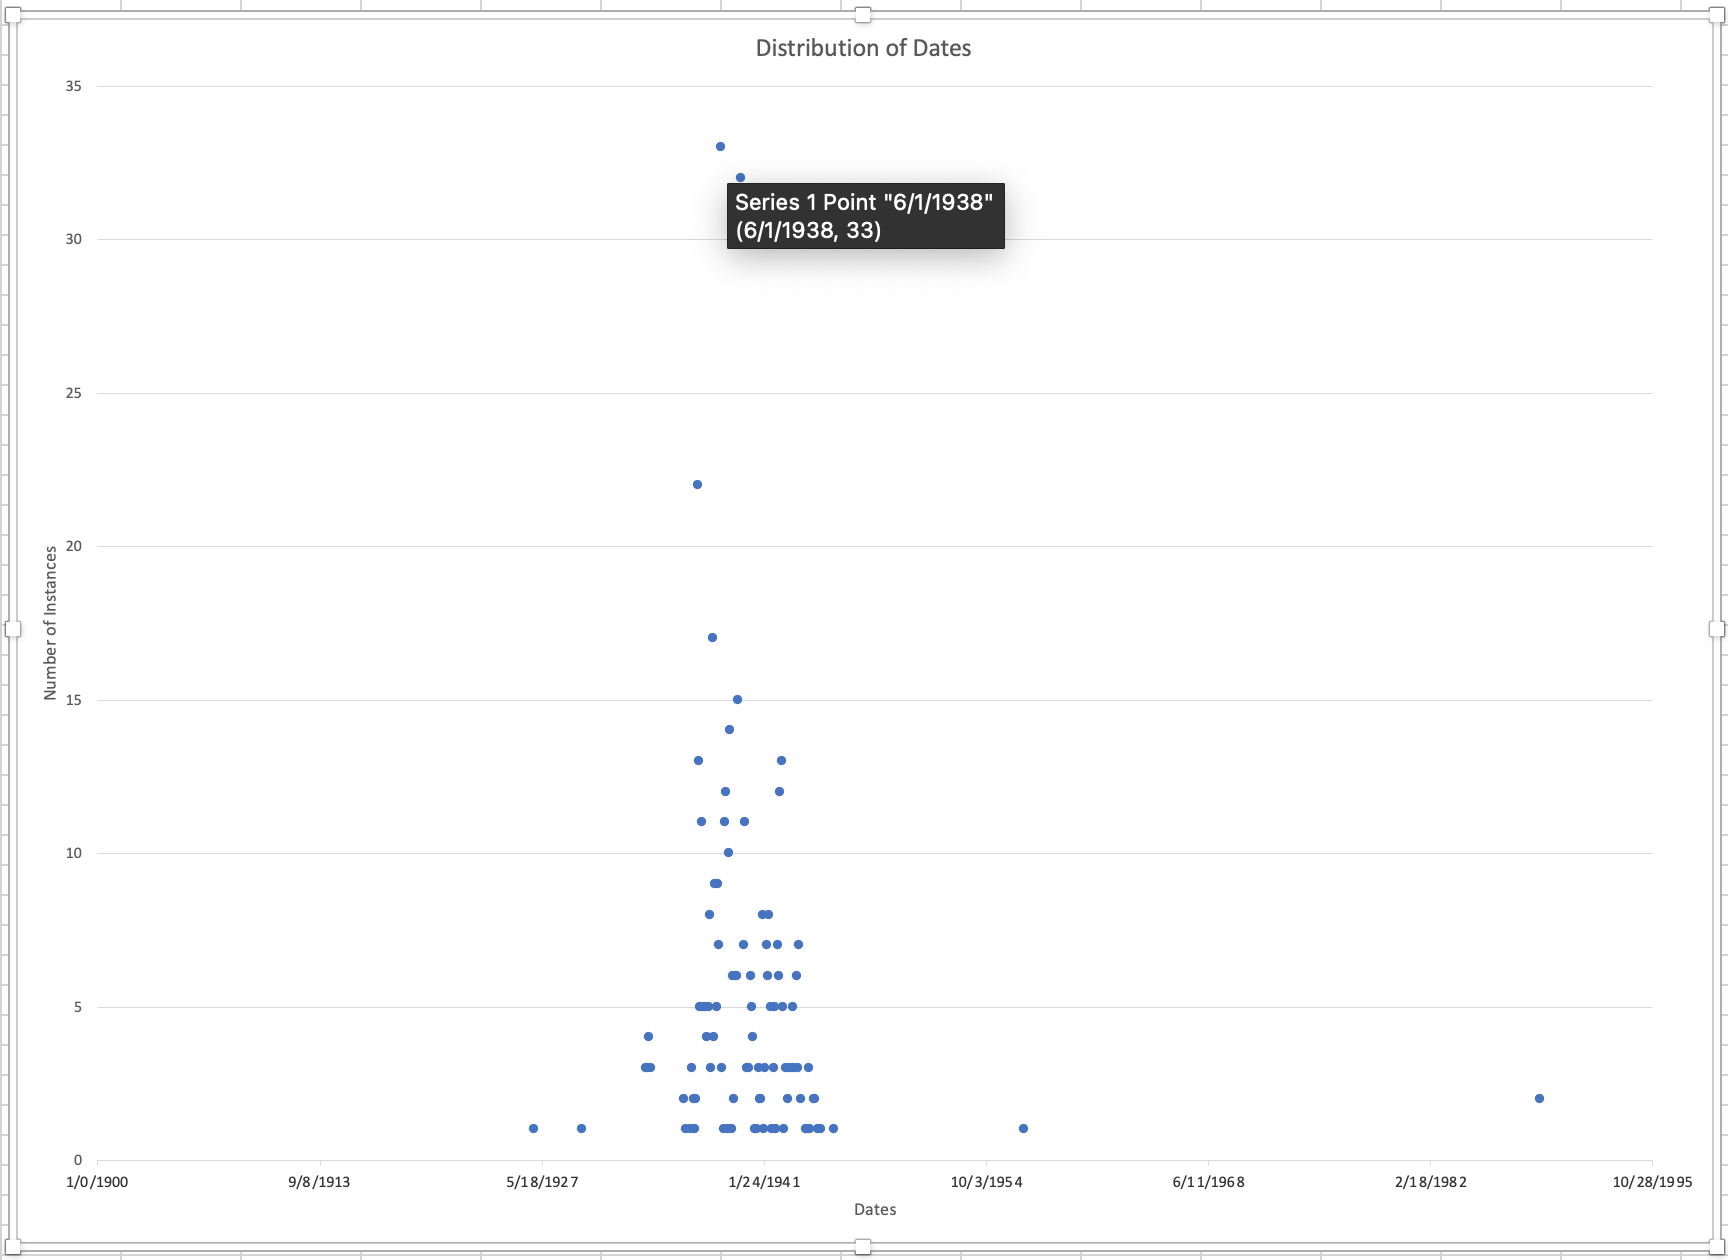
- Select both columns and create a scatter plot chart. Make sure that the dates are on the x-axis. Edit the axis labels and title to be presentable.
- Note that there are outliers (two notes in 1988???) and that most of the dates are from the late 1930s/early 1940s.
Modeling: Computation and Transformation
We used the CSV from OpenRefine to model and create a visualization (in Excel) of our dataset representing the distribution of dates by month filtered by finance-related keywords from the cards. As seen in our scatter plot in Figure 3, the most active date from the dataset was in June of 1938, with 33 cards listing that date. There were also a few outliers: one card from December 1926, one card from November 1929, one card from February 1957, and two cards from December 1988. These are most likely the result of OCR and conversion errors. Most of the dates are from the late 1930s/early 1940s. (KD)

Modeling: Visualization
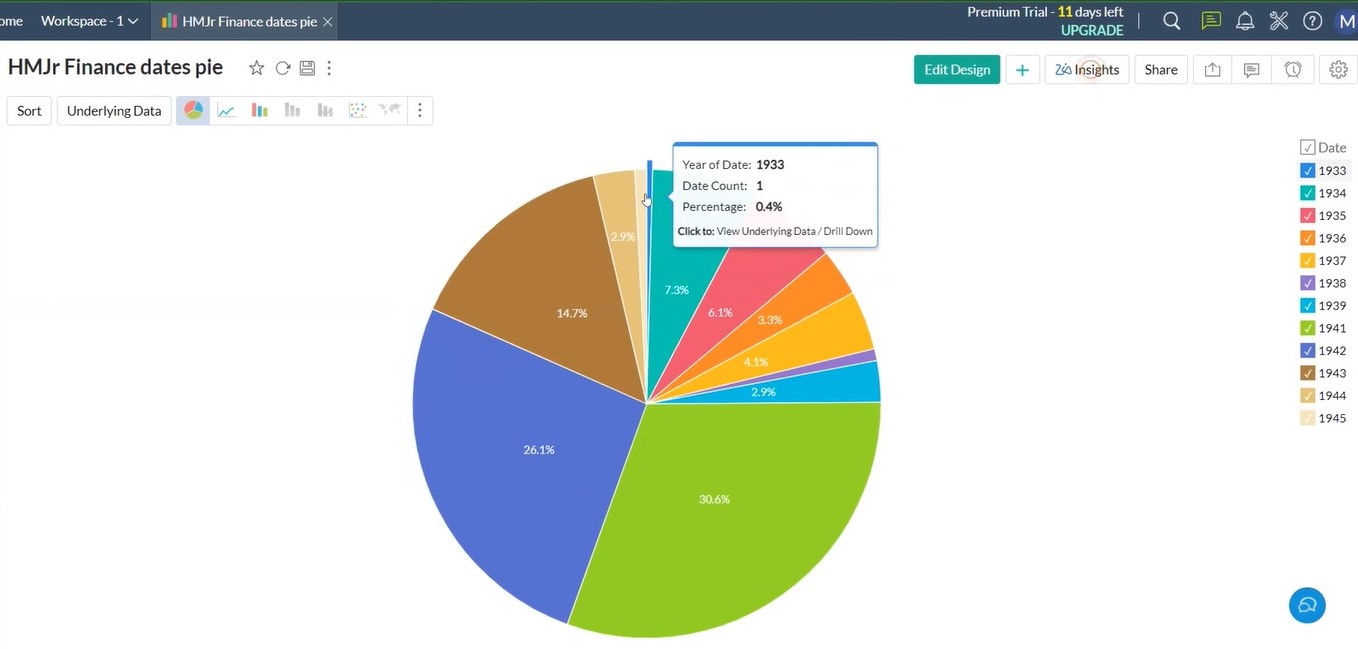
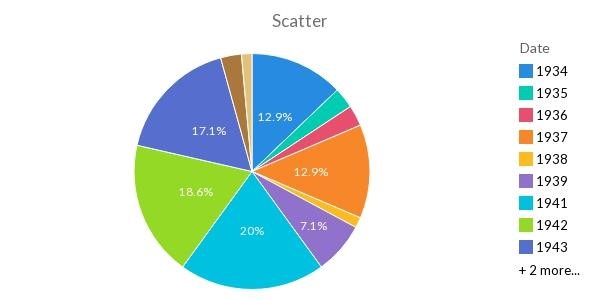
With our Excel file, we carefully corrected the (DocDrop) OCR’d data to match the original images and adding the book numbers which did not translate into OpenRefine. That was then sorted by date and imported into Zoho’s analytics function. Zoho was used to model the information and add filters to further model the data. Filters were helpful in narrowing the results to only the relevant information in records that contained key strings in either their heading, contents or both. Some key terms were “finan”, “fisc,” “mone,” “coin,” “debt,” and “silver.” The keyword-filtered and year-sorted dataset was then exported as an Excel sheet (with SB) and also used with Zoho’s Reports feature to create scatter, pie (shown), and line graph visualizations. Reports-generated visualize the distribution of years across the mentions of financial matters in the selected range of index cards.
- Figure 4: Volume of mentions of key terms in headings alone by date. It shows that Morgenthau addressed financial topics most frequently in 1941: 75 unique times according to card entry (30.6% of our 1933-1945 dataset range).
- Figure 5: Volume of mentions of key terms in headings and contents by date. (MM)
- Figure 6: Distribution of dates by year in the partial dataset. (KD)


Ethics and Values Considerations
- Validity: Acknowledge that human error and computer software error occur, and as a result, the data could be skewed.
- Clarity: Ensure the data and information shared in this computational story flow together. In addition, our group wanted to make sure our work could easily be used by the public.
- Accountability between original and manipulated sources: Acknowledge that the work we have done through this manipulation is our interpretation of the source, and our interpretation should not replace the original source. Throughout our analysis, we found some outdated language, particularly with the country of Estonia. On card 192, we found that the country of Estonia was spelled Esthonia with an “H.” Is it the role or right of the record manager to update spellings of archaic language so that records can be more discoverable and used by the public? (HS)
Summary and Suggestions
A good portion of the OCR from DocDrop remains not perfectly optimized. DocDrop did not recognize all of the book and page numbers, causing it to be too challenging to create a column in OpenRefine for "Source," as planned. In the future, all the OCR errors, along with any typos and misspellings on the original cards, should be manually corrected. Such corrections will increase the quality and future use of the records (Underwood et al., 2017). As they note, this type of work takes an entire project team to complete. After the OCR has been perfectly optimized, the data can be further manipulated in OpenRefine, thus enabling the creation of more reliable visualizations. (KD)
References
- Carter, K.S., Gondek, A., Underwood, W., Randby, T., & Marciano, R. (2022). Using AI and ML to optimize information discovery in under-utilized, Holocaust-related records. AI & Society 37(3): 837-858. https://doi.org/10.1007/s00146-021-01368-w
- Gondek, Abby S. (2021, January 14). “New developments in Holocaust Studies and the Digital Humanities: Female staff and the U.S. Government’s rescue effort.” Presented at #DHJewish 2021: Jewish Studies in the Digital Age. https://doi.org/10.26226/morressier.5fd8d8c83d762219be34f4e3 and https://abbysgondek.com/portfolio/new-developments-in-holocaust-studies-and-the-digital-humanities/
- Underwood, W., Marciano, R., Laib, S., Apgar, C., Beteta, L., Falak, W., Gilman, M., Hardcastle, R., Holden, K., Huang, Y., Baasch, D., Ballard, B., Glaser, T., Gray, A., Plummer, L., Diker, Z., Jha, M., Singh, A., & Walanj, N. (2017). Computational curation of a digitized record series of WWII Japanese-American Internment. 2017 IEEE International Conference on Big Data (2nd Computational Archival Science (CAS) Workshop) (pp. 2309-2313). https://doi.org/10.1109/BigData.2017.8258184