Morgenthau Diaries Volumes 3 to 5 (1 January – 30 May 1935): “Gold, Silver, and Value of American Dollars”
by SC, NF, RM, MM
Data Overview, Telling Our Story
NB: This Story is about a separate Morgenthau collection, so it may complement the other Press Conference notebooks.
The data found within the Morgenthau diaries volumes 3-5 highlight the importance of United States fiscal policies in 1935. The mention of gold and silver dominated the data, as well as the value of American dollars. With the provision of historical context, such as the Gold and Silver Reserve Acts, insight was provided into the effects of the acts on the value of the American dollar. (RM) With our manipulations of the data, a story of the foreign and domestic exchanges of the United States within the aftermath of the Great Depression and World War I presents itself. Visualizations aid in describing the computational manipulations done and our interpretation of the results. (SC) Overall, this was an interesting assignment with lots of hurdles but it was fun to see all of the presentations kind of lead into each other. (RM)
In his 12 years as Secretary of Treasury, Morgenthau compiled diaries consisting of 860 volumes of his work letters, meeting transcriptions, and other official duties from April 1933-July 1945. These diaries provide significant insight into United States fiscal policies during the Great Depression, the development of the New Deals, and WWII. Composed of 285,000 pages, the diaries were split into three series for easier navigation: the Morgenthau diaries, the Morgenthau presidential diaries, and the Morgenthau diaries index. (RM)
Dataset Exploration related to Scale and Levels within Collection
Our Story focuses on volumes 3, 4 and 5 of the Morgenthau diaries series, which span January 1-May 30, 1935. Within these volumes are references to the value of the American dollar and its effects on international markets such as Great Britain and France. We decided to explore this subject further by focusing on any fiscal programs involving the value of the United States dollar. This includes any mention of the repercussions of the Executive Orders 6814 and 6102 which required all substantial amounts of gold and silver in the United States to be given to the Federal Reserve (Elwell, 2011).
The dataset our group evaluated consisted of three volumes in eight distinct parts and contained a vast amount of information pertaining to events taking place in the United States between January 1-May 30, 1935. The data within the volumes was difficult to scan by most optical character recognition’s (OCR) and required several attempts to produce readable data.
After running the different volumes through Google Docs, Voyant, and other programs such as Notebook LM we noticed most of our data focused on money. A clear pattern emerged regarding the United States’ relationship with gold. From January 1935 to May 1935, data trends, rates of key word use, and historical context (Glick, 2009) all point to the United States engaging in the reshaping of national laws and foreign policy with England, France, China, and Poland to maintain the value of gold and restabilize the economy. (MM)
Data Cleaning and Preparation
Our objective was to discover patterns within the designated dataset relating to the various changes that the economic market underwent during Morgenthau and Roosevelt’s time in office. To accomplish our goal, our group first needed to mold the data compiled within 7 PDFs spanning over 1,000 pages. Our group split the sections of Volume 3, 4, and 5 between ourselves, before attempting to place them into OpenRefine. Quickly we discovered that PDFs were not supported by the program, so we used Doc Drop to convert the documentation into an OCR. We then used a trick we found in one of the previous classes’ CASES notebooks, using Amazon Textract and Google Docs to translate the OCR. Taking this final document into OpenRefine, we had a usable dataset. Voyant and Notebook LM were then used to develop visual aids for our presentation.
Modeling: Computation and Transformation
Manipulating the data is a necessary facet of making the data explorable and understandable. Changing the way the data was originally presented, from PDFs on the presidential library website, to text-based files allowed us to understand the story more easily within our volumes. Given our group was larger, the volumes had over 1,500 pages, which made manipulation even more important. There would be no way we could parse through the information in a timely fashion otherwise.
Our first consideration was how to tackle the number of volumes. We split the volumes among ourselves and then manipulated our individual volume assignments in external applications. In many instances, the PDFs were difficult to work with. We used a variety of applications to clean and manipulate the data in our PDF volumes based on personal preferences; some of us opted for no-code options, while others were confident with coding, such as what was required with Amazon Textract. We utilized Google Docs and a variety of Optical Character Recognition (OCR) readers to acquire the text from the PDFs that could then be parsed through, cleaned in OpenRefine, and manipulated in platforms such as Voyant.
Parsing through the data took a variety of forms, from simply using the find function to search for keywords in the text, to using facets in OpenRefine to create comma-separated values (CSVs), to utilizing Google Notebook LM for interpretations of the mass amounts of text. After manipulating and transforming the data in our volumes, the path to take for visualization became clearer. After transforming the PDFs into usable data, we explored the fiscal policies of the United States and their effects on gold and silver, domestically and internationally (Richardson, Komai, & Gou, 2013; Selgin, 2020).
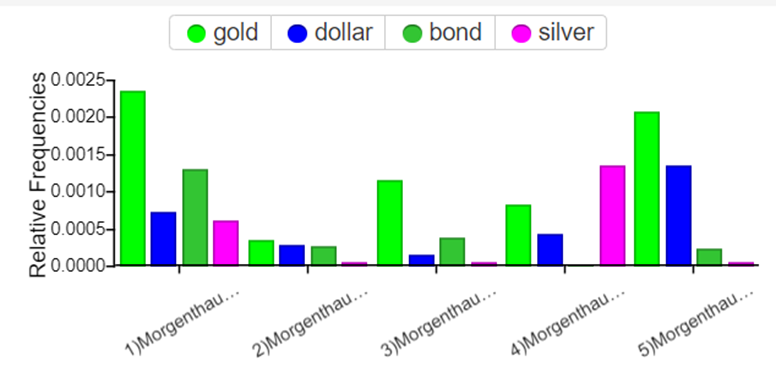
As seen in Figure 1, we were able to find a good amount of information on dollar values, silver, gold, etc. from the dataset to explore. Created in Canva, the (bar) graph portrays the frequency in which the topics of gold, bonds, dollars, and silver were mentioned within the Morgenthau diaries starting with Volume 3, Part 1 – Volume 5, Part 1. (RM) It illustrates just how frequently these topics were discussed, with gold being discussed the most. (NF)

Modeling: Visualization
Storytelling our usable data took additional platforms and resources. Voyant, for instance, provided a platform to input the cleaned text and analyze the keywords with other metrics, such as the rate of word occurrence. Visualizations included word webs and a word cluster. To present our data in a way conducive to telling a story, a bar graph was a worthy element to utilize.
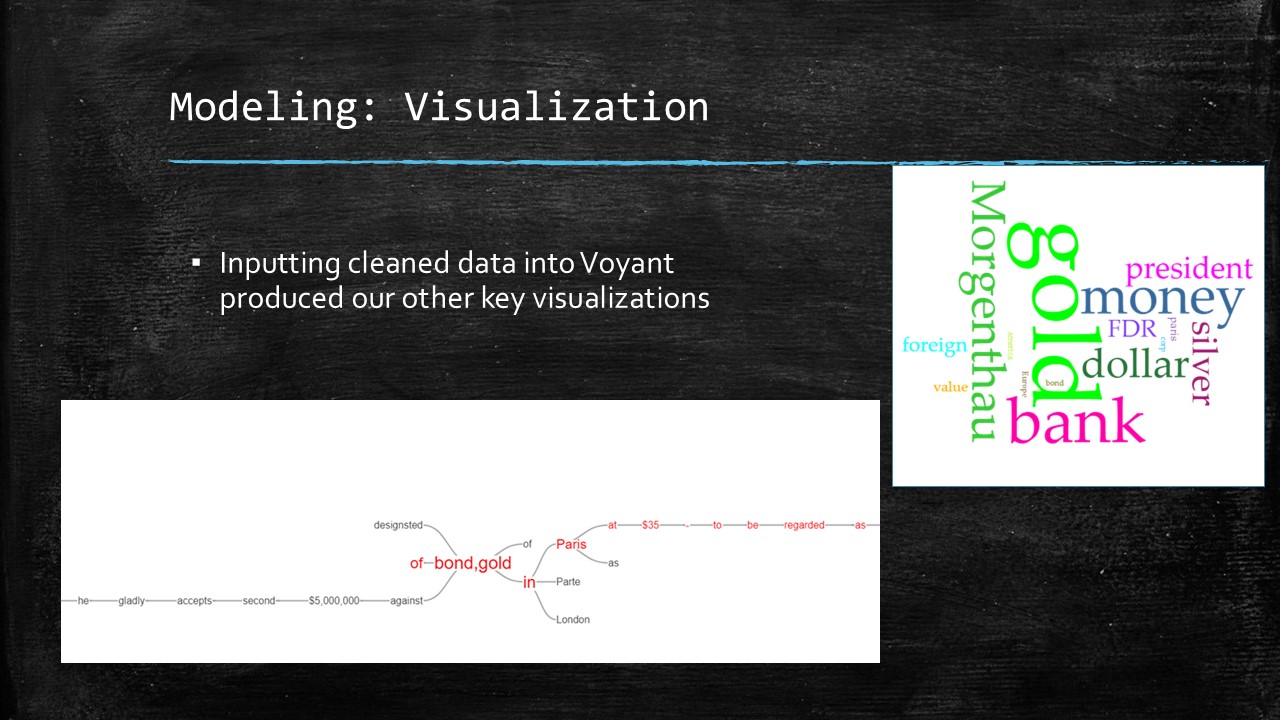
Voyant offers multiple visualization widgets and avenues for manipulation of the data. Figure 2 is a valuable visualization of a word cluster with the most often repeated words in Volume 5, highlighting which words are more used than others and displayed based on size. This visualization is useful for quick insight as to what words are important and what topics are prominent in the data. Figure 2 also depicts a word association map where the words “gold” and “bond” are selected from the data to generate a map of the most often associated words with the selected words. (SC)

Ethics and Values Considerations
Maintaining the accuracy of the information presented in historical research and being transparent about the methods and data used is an invaluable practice we aim to uphold. As we delved into Morgenthau’s press conferences; by cross referencing and verifying the information presented from the primary sources with other scholarlily sources or historical records, we were able to manage fact-checking and reduce errors in our data modeling strategies and evaluation. It is important to note our evaluation uses information extracted from volumes 3-5, and this could mean the data set is incomplete or limited.
There is a consideration and awareness for the historical context and interpretation of the time period's topics. By understanding the press conferences’ historical context, we were able to interpret the insights from the documents more accurately and meaningfully. The 1930s were a tumultuous time, as political tensions led to World War II and the U.S. remained in economic and social recovery from the Great Depression.
Remaining neutral or impartial is crucial for historical analysis. Considering the value of avoiding bias in our interpretations, a level of caution and peer review is implemented to extinguish personal bias or preconceived opinions that influence any results. By demanding objectivity and critical evaluation, we can present our interpretations of the historical events and economic outlooks discussed in the press conferences.
Summary and Suggestions
After we analyzed and manipulated our assigned sections we found some commonalities between the diary volumes. We chose the strongest commonality, which was the valuation of the United States Dollar in connection with the rates of gold and silver at the time. An interesting further exploration of the data would be to consider the context of the British Pound and the French Franc in relation to the value of the dollar, which could help provide global context to the period covered in these volumes. (NF). By examining the information extracted from Morgenthau’s press conference documents, our group chose to highlight the relationship between the US dollar’s valuation, and the rates of gold and silver. Our emphasis on the prominent key phrases such as “dollar,” “gold,” or “bonds” shows our commitment to uncovering significant economic insights in the interest of adding historical value to our primary source. We recommend a deeper exploration into the historical context of currency fluctuations but additionally, more consideration and further analysis of emerging technologies and their influence on currency and the global economic markets is warranted. Looking at the impact of digital currencies and blockchain on traditional systems could provide insight and avenues for future investigation. (SC)
Suggestions: I believe further work could be done to clean the dataset and more accurately pull information from the texts, were we to be given more time to familiarize ourselves with OpenRefine and the process of manipulating datasets. Furthermore, our Computational Story if we were able to examine a broader range of documents, perhaps some records from England and France regarding their economic relationship with America during Morgenthau’s time in office, could grant us a bigger picture of America’s economic foreign maneuverings. (MM))
Reference
- Elwell, C.K. (2011). "Brief history of the gold standard in the United States." Congressional Research Service. https://sgp.fas.org/crs/misc/R41887.pdf
- Franklin D. Roosevelt Presidential Library and Museum. (2011). “Diaries of Henry Morgenthau, Jr., April 27, 1933-July 27, 1945: Series 1.” http://www.fdrlibrary.marist.edu/archives/collections/franklin/index.php?p=collections/findingaid&id=535&q=&rootcontentid=188897#id188897
- Glick, D. (2009). Conditional strategic retreat: The court’s concession in the 1935 gold clause cases. The Journal of Politics, 71(3), 800–816. https://sites.bu.edu/dmglick/files/2015/01/Glick-2009.pdf
- Richardson, G., Komai, A., & Gou, M. (2013). “Roosevelt’s gold program.” Federal Reserve History. https://www.federalreservehistory.org/essays/roosevelts-gold-program
- Selgin, G. (2020). “The New Deal and Recovery, Part 7: FDR and Gold.” Cato Blog. https://www.cato.org/blog/new-deal-recovery-part-7-fdr-gold