Volumes 12-13 (16 Jan - 30 Dec 1939): “Foreign Relations-through-Trade, Silver, & Douglas”
by TG, JM, RP
Data Overview, Telling Our Story
Exploring Conversational Topics: An Exercise in Computational Thinking. Volumes 12 and 13 of the Press Conferences of Henry Morgenthau, Jr. collection encompass the transcripts taken during the year of 1939. They run from January 16 to December 30, with Vol 12 encompassing January 16 to June 29, and Volume 13 running from July 6 to December 30.
Volume 12 is primarily focused on foreign relations through trade. There are mentions of loans given to countries in Latin America, Czechoslovakia, and the United Kingdom. There are mentions of previous war debts and extension of credit to European countries. There is also mention of implementing new monetary notes from the Treasury, which was released as a statement to the newspapers. The final entry date of June 29 in this volume deals extensively with foreign and domestic silver, primarily from foreign trade with Canada. There is mention of the Silver Purchase Act and increased tax from domestic purchases of silver.
Volume 13 is set right during the beginning of World War II, so there is conversation regarding trade and discussion between treasuries from Europe and the United States Treasury. There are two press conferences set in September that deal with foreign trade and foreign exchange post the outbreak of war in Europe. There are wartime conversations and discussion on the topic of American neutrality in the war in Europe. There is mention of Japan and trade changing that was discussed as well near the end of volume 13.
An overall view of the data found in both volumes 12 and 13 highlights conversations about foreign trade, changes in the cost of silver both domestic and foreign, foreign debts, and financial aid in times of crisis. Foreign relations with opposing nations is also prominent, building up more towards the end of the 1939 document (TG).
Dataset Exploration related to Scale and Levels within Collection
The primary objective from our dataset was figuring out what the top-spoken topics during the time period of Morgenthau’s Press Conference volumes 12 and 13. From there, we further focused on who would benefit from having access to the information and how that would help guide how we manipulated our data and what we would look for in regards to both showcasing and manipulating the data that we found. Going from the viewpoint of an economic background or a historic background, both forms of research could benefit from the data that we glean from these volumes in the Morgenthau collection. Researchers interested in discovering monetary trade issues around the start of World War II would find the topics of our data helpful, both from a historical standpoint as well as an economic one (TG).
Data Cleaning and Preparation
The original files of our data were PDF documents scanned in for the FDR presidential library and museum. These files contained the press conferences from Henry Morgenthau Jr, spanning from the years 1933-1945. Conversion to transferable data from the PDFs were made into CSV via Convertio. We transferred into two different softwares, using both OpenRefine and Voyant (TG).
Modeling: Computation and Transformation
Our group worked with vol.12 and vol.13 of the bound collection titled Press Conferences of Henry Morgenthau, Jr., 1933-1945, received as PDFs courtesy of the Franklin D. Roosevelt Presidential Library and Museum. These PDFs were not usable on their own as we were not able to download PDFs directly into the OpenRefine software that we wanted to use to clean up our data. Therefore, our first step in the manipulation of these PDFs was to make them readable in our software. We used two tools to accomplish this goal, OCR.Space and Convertio.co. The first few tries led to a lot of gibberish. The converters were unable to translate the PDF into clear and concise words, instead coming out as a mixture of random letters, numbers, and special characters. Figuring out the right software to use was important, as they did not all produce the same results. Once we had a Google Doc that had clearer, although not perfect, text from OCR.Space, we were able to use Convertio.co to change the document to a CSV format. The CSV could easily be uploaded into OpenRefine.
With OpenRefine, and some manual manipulation in Excel, we were able to clean up the data to form separated words that we could then use to create our visualization. This process was also not perfect and required a lot of trial and error. When the document was first uploaded it had a lot of blank spaces and multiple words in one cell (Figure 1: Vol 13 Initial Data). With OpenRefine, we were able to split each word into a separate cell. We were also able to get rid of all the null rows in the column. In OpenRefine, we also managed to use the cluster tool in order to combine all misspelled versions of a word into one grouping (Figure 2: Vol 13 Clean Data). This would be highly beneficial once we started working on visualizations (JM).


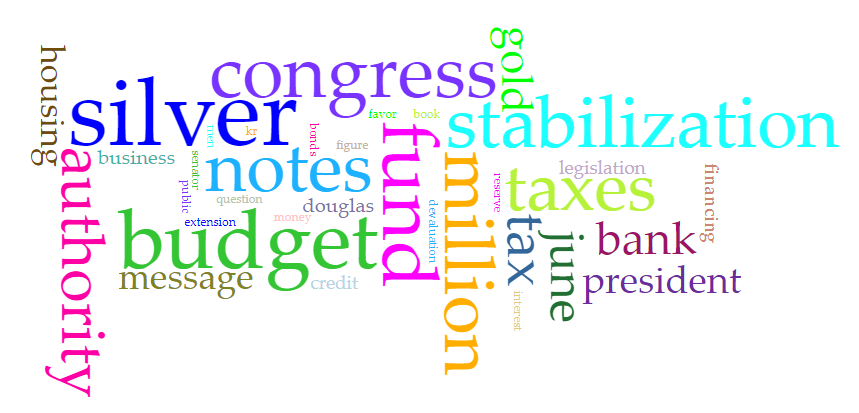
Pre-Visualization: Finding a software to create visualizations of our clean data presented another challenge. Voyant, a web-based text analysis software, was an option that produced quick and efficient results. We were able to enter both volumes’ CSV documents into the program and visualizations were created almost instantly (Figure 3: Vols 12-13 WordCloud). Still, despite this effective software, problems still occurred. One problem was that the word cloud was producing words such as “go,” “to,” “just”, and “way.” It was also producing non-existent words such as “1k,” “1r,” and “kre.” The stopwords feature of Voyant was able to eliminate these words, but only ones we were able to see and type into the program. Such error in data may have been solved in a different program or if we possessed a higher knowledge of how to work OpenRefine, since these words should have been addressed when cleaning the data.
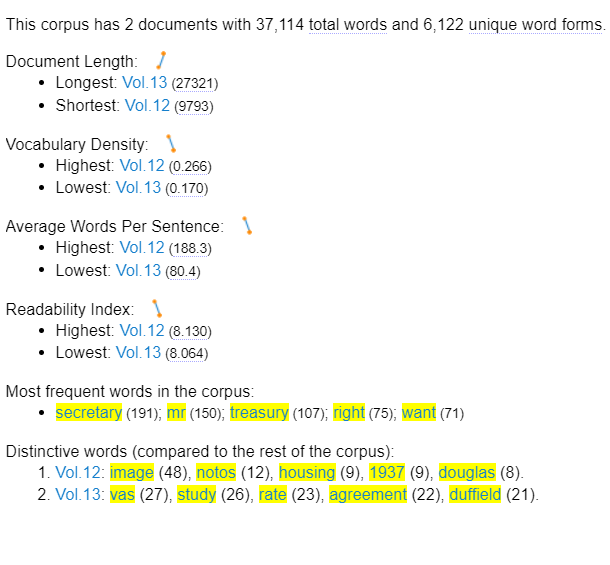
Another feature of Voyant when using multiple CSV files is to determine the most frequent words and the most distinctive words in the combined and the separate files. The most frequent words when first entered into the software included “secretary,” “mr,” and “treasury.” Those are obvious and not very useful to those looking to discover what was talked about in these press conferences. Still, with further cleaning of the data and the further manipulation of information in Voyant, it could be a useful feature. Under the time constraints of this project, the frequency feature will have to be done in the future. The other frequent words in this document, “right” and “want,” would also need to be eliminated via stopwords since they are not descriptive enough to give information on the documents. A similar problem occurs in the feature of distinctive words. Words that are non-descriptive or those that are not words at all would have to be eliminated to make this feature useful (Figure 4: Vols 12-13 Frequent and Distinct Words). Future projects could and should elaborate on this work, using the features of Voyant, but learning from the troubles that we had with cleaning the data and the manipulation of data (JM).


Modeling: Visualization
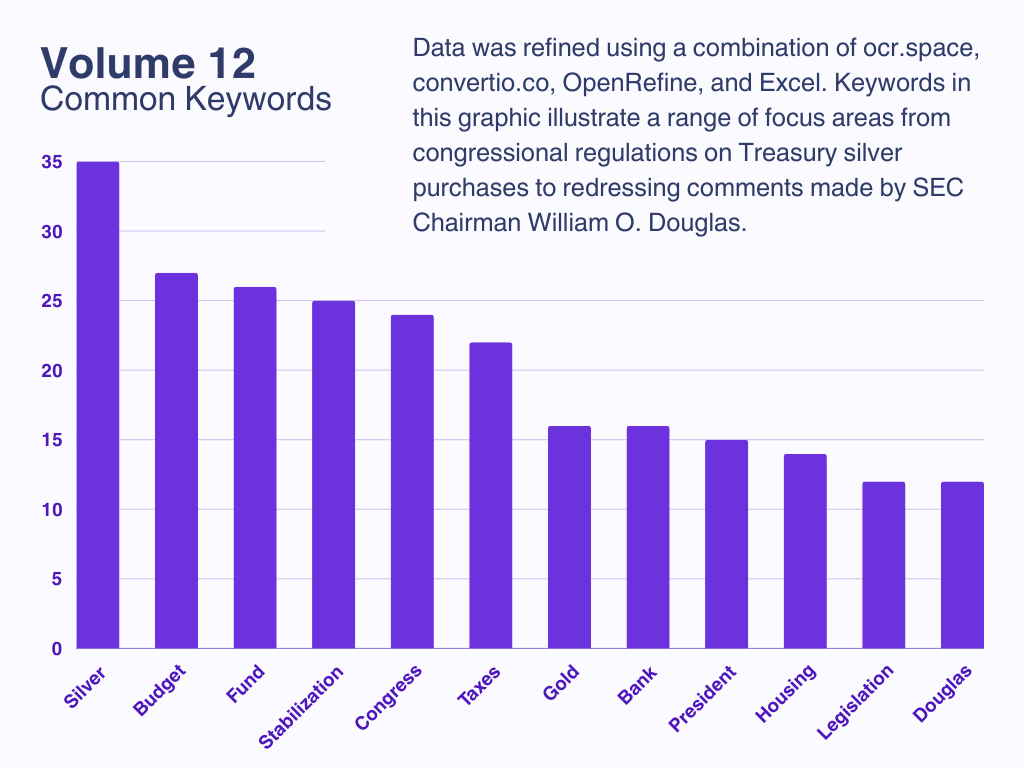
Volume 12: As described, once we had obtained OCR results that we felt were of an acceptable quality, we converted the text to a CSV format before proceeding to clean the data in: OpenRefine (using facets to filter out blank rows and duplicate entries, using the OpenRefine-specific “General Refine Expression Language” (GREL), and using clustering functions to merge similar terms), Voyant (revising “stop words” settings to English, selectively adding additional “stop words” to be filtered from the list (such as “the”, “and”, “is”, etc.), limiting the number of displayed terms to allow for better readability), and Excel (spellcheck, find & replace functions used to further merge similar terms). Once the data was refined we were finally able to create data visualizations using Voyant and Canva, including the bar graph (Figure 5: Vol 12 Common Keywords) and word cloud (Figure 6) below (RP).


Results: Our visualizations show the most frequent keywords used in Vol. 12 of the press conference transcripts. These visualizations exclude stopwords, but also exclude frequent words such as secretary, mr, and treasury – non-descriptive words which would not be helpful in determining topics of conversation in this time period. The remaining frequent words show areas of conversation. For example, the most common word, silver, refers to conversations regarding the Silver Purchase Act and the foreign and domestic purchase of silver. Another frequent word, the name Douglas, can show who was a key player in these conversations besides the secretary himself (JM).
Ethics and Values Considerations
Access to the press conferences was provided by the Franklin D. Roosevelt Presidential Library & Museum, and our access did not impact the integrity, confidentiality, accessibility, documentation, or retention of the materials (Raines and Dibble, 2021). Our primary ethical concern was the accurate representation of the contents within the press conference transcripts. In practice, this came down to the terms that we chose to filter, or exclude, from the final lists of most common terms. By only removing what we deemed to be superfluous or redundant words, we aimed to ensure that the data visualizations were relevant and easily digestible, while remaining accurate and faithful depictions of the source content (RP).
Summary and Suggestions
In this exercise, data was extracted and refined from within volumes 12 and 13 of the press conferences of Henry Morgenthau, Jr. as hosted by the Franklin D. Roosevelt Presidential Library & Museum. Various computer-based tools including ocr.space, convertio.co, OpenRefine, Voyant, and Microsoft Excel were used to facilitate this process.
OCR was used to convert the PDF images into usable text, which was then converted into CSV format before being further cleaned and clustered using the aforementioned tools in order to determine the most frequently occurring keywords. These keywords were further processed to filter out superfluous terms and characterize topics of interest. Finally, the data could be visualized using methods such as word clouds and bar charts to indicate the prevalence of certain topics, thereby using computational methodology to extract and illustrate the primary topics of interest in Henry J. Morgenthau’s 1939 press conferences.
Future researchers undertaking further or similar analysis would benefit from a cursory introduction to the concepts of computational thinking prior to commencing, as a lack of familiarity with available tools, workflows, and methodology may lead to disproportionate amounts of guesswork and experimentation, as it did in this exercise. A lack of prior practical experience with data visualization also hindered progress, as did uncertainty about how to approach and resolve issues encountered during the course of the exercise (such as poor OCR, lack of knowledge surrounding the conversion of data to CSV format, unfamiliarity with OpenRefine, little knowledge of optimal methodology, and uncertainty about whether results would satisfy expectations). Our foremost suggestion for future researchers undertaking a similar endeavor (and with a similar lack of prior expertise) is to prioritize preparation and invest in familiarization with the tools and options available. Efficiency and effectiveness would also be facilitated by previous knowledge of data manipulation or familiarity with relevant techniques (familiarity with Python, RegEx, etc.).
In the end, our struggle to figure out each step of the data visualization and storytelling process yielded a small number of helpful visualizations that illustrate key topics discussed by Morgenthau in 1939. Equally importantly, this exercise introduced us to the concept of computational thinking. Despite the uncertainties we faced, we gradually made small victories and ultimately gained a degree of experience with manipulation of datasets that we will be able to draw upon in future attempts at telling stories through data visualization.
References
- Franklin D. Roosevelt Presidential Library & Museum. (n.d.). Press Conferences of Henry Morgenthau, Jr., 1933-1945. http://www.fdrlibrary.marist.edu/archives/collections/franklin/index.php?p=collections/findingaid&id=536
- Morgenthau, H. (1939). Press Conferences Volume 12, January 16, 1939-June 29, 1939. http://www.fdrlibrary.marist.edu/_resources/images/morg/mp19.pdf
- Morgenthau, H. (1939). Press Conferences Volume 13, July 6, 1939-December 30, 1939.
http://www.fdrlibrary.marist.edu/_resources/images/morg/mp20.pdf
- Raines, J. & Dibble, N. (2021). Ethical Recordkeeping. In Ethical Decision-Making in School Mental Health, 2nd Ed. Oxford University Press. https://doi.org/10.1093/oso/9780197506820.003.0008