Volumes 17-19 (2 Jan – 29 Dec 1941): “Defense Savings (Series E) Bond, Great Britain, Germany, Italy”
by LB, SR, JT
Data Overview, Telling Our Story
As we conducted our collection survey, our group identified several key recurring themes including discussions revolving around the Lend-Lease Act, Defense Savings Bonds, stabilization fund, and general freezing orders. After conducting background research on the time period, we discovered that these conversations referenced to historically significant moments in 1941 for the US Treasury Department. The following were enacted or took place during the year: Lend-Lease Act (March 11), Series E Bonds (May 1), Executive Freeze Order (June 14), attack on Pearl Harbor (December 7). Our primary focus of this project was to understand which countries’ assets were being supported by Morgenthau and the Treasury and which were under fire. Our aim was to map out the significance of these economic attacks to the US press and determine the overall concern of the American people before joining the war.
Three types of visualizations were created: symbol maps, a word cloud, and a bar graph. The visualizations of information simplify a complex set of PDF documents into easy to understand representations that answer our research questions about financial manipulations and the countries often discussed throughout the press conferences. We continuously noted that the increase in use of certain terms or references to particular countries corresponded with the historical events previously mentioned.
In conclusion, we came to the realization that our goal was too broad for our specific data set. While we were able to map out and note the significant concepts of the year, we were not able to identify the impact of these on the American people. That being said, we have met the overall goal of clearly identifying the key concepts of these volumes for future researchers to interact with each data set. In context, we have created a clear and concise understanding of the most prevalent topics of the year 1941.
Economic Warfare in 1941: Occupying Foreign Assets and Supporting the Allies. A Computational Story of Henry Morgenthau’s War Efforts before Pearl Harbor. On December 7th of 1941 the Japanese attacked Pearl Harbor and officially launched the United States into World War II. In the months leading up to this day, the United States government, led by President Roosevelt, had already committed billions of dollars in aid in the form of commercial goods to the allies in Europe. The Lend-Lease act was signed in Congress on March 11, 1941 and created the system by which the US would “lend” materials to countries fighting in the war effort and defer payment to a later date [8][3]. This act created a concern in the US press about foreign debt in America. How would those accounts, which these countries had with private companies, be paid? These questions were directed to Henry Morgenthau Jr., the US Secretary of Treasury, on March 13, 1941 (Vol. 17).
In May of the same year, the Series E bond, or “Defense Savings Bond,” hit the market and was the primary focus of most of Morgenthau’s conferences between May 1 and September 29 (Vol. 18). The Series E was designed to allow the American people to ease their conscience by contributing to the European war effort in the form of a low-risk, interest bearing bond which would be returned to them in 10 years [6]. For those who could not afford a bond, they had the option to purchase stamps, which, after enough had been purchased, would become a bond. By September 11, the U.S. Post Office had made over $13 million from the sale of stamps alone for the War (Vol. 18).
For Morgenthau and FDR, contributing financially to European allies was not enough; as a result they developed a plan to freeze foreign assets in the US and enacted it through an executive freezing order on June 14, 1941. By October of the year, the US “occupied” the property of 32 countries that were either affiliated with or in danger from the Axis Powers [7]. The goal being “economic warfare,” ensuring the enemy did not have the necessary funds or resources to advance [7][2]. In addition, Morgenthau worked tirelessly on stabilizing the US dollar and the currency of other Allied powers [1]. By strategically buying and selling gold or silver, Morgenthau was able to prevent another economic collapse for not only the US but other countries as well, including Mexico (Vol. 19)[1].
As a Jewish man that was close to the president and part of the cabinet, Morgenthau was seen as a potential hero for refugees fleeing from the Holocaust [2]. He did not voice his opinion on increasing immigration, but instead focused his power on destabilizing the German and Japanese war front [2][1]. Understanding this, our group decided to take a closer look at how Morgenthau impacted the war by manipulating foreign assets. Using the press conference data, we focused on which countries were under the freeze order and which were being supported by defense bonds. Our overall goal was to understand how concerned the press, and by extension the American people, were about the US financially meddling in the war (JT).
Dataset Exploration related to Scale and Levels within Collection
Each press conference was transcribed by Henrietta Klotz who wrote them in a simple Question and Answer pattern and identified each conference by date at the top of the starter page. Each “Q” referred to a question or statement from the press and the “A” indicated an answer or statement from Morgenthau. None of the members of the press were ever formally named by Klotz in these transcripts. On occasion, Klotz would identify another member of the treasury department, who was present to answer questions, by name rather than “A”. The associates which appeared in 1941’s conferences included Harry Dexter White, David Bell, Harold Graves, Edward Foley, and Charles Schwarz.
A few errors that were noticed were as follows: indecipherable smudged words, repeated pages, and typos. They made it difficult to convert the data set into readable text using docdrop and some pages had to be manually removed from the PDF to convert the entire data set into csv files for OpenRefine. In addition to the conferences, Klotz included press releases in these volumes which consisted of Morgenthau’s radio addresses, data regarding bonds, and treasury proposals. All of these had to be trimmed from the final data but provided valuable context to the group.
The collection as a whole is massive in size and spans from November 15, 1933 to July 23, 1945 (see Figure 1). Our group alone handled, read, and manipulated 1,161 total pages and we were able to pull 22,234 rows of data in OpenRefine. By concentrating on one year, we were able to take a closer look at how the historical events happening nationally in 1941 were impacted by the US treasury and Morgenthau’s role in the escalating war efforts (JT).
The group used the following research questions to guide our computational story (Figure 2):
- How did Morgenthau’s actions in 1941 contribute to his goals of stopping the influx of funds to axis powers and helping Jewish refugees?
- How many times are countries mentioned during press conference conversations in relation to war finances?
- How many countries was the US offering aid to versus the number of countries' funds they were freezing?
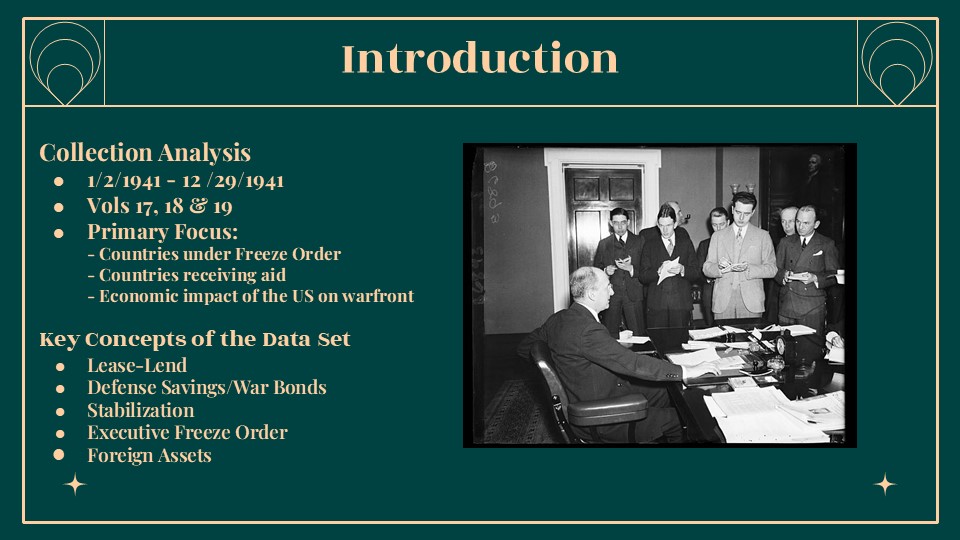
Figure 1. Photo Source: https://loc.getarchive.net/media/treasury-press-conference-this-photograph-the-first-of-its-kind-shows-secretary-84d0c6
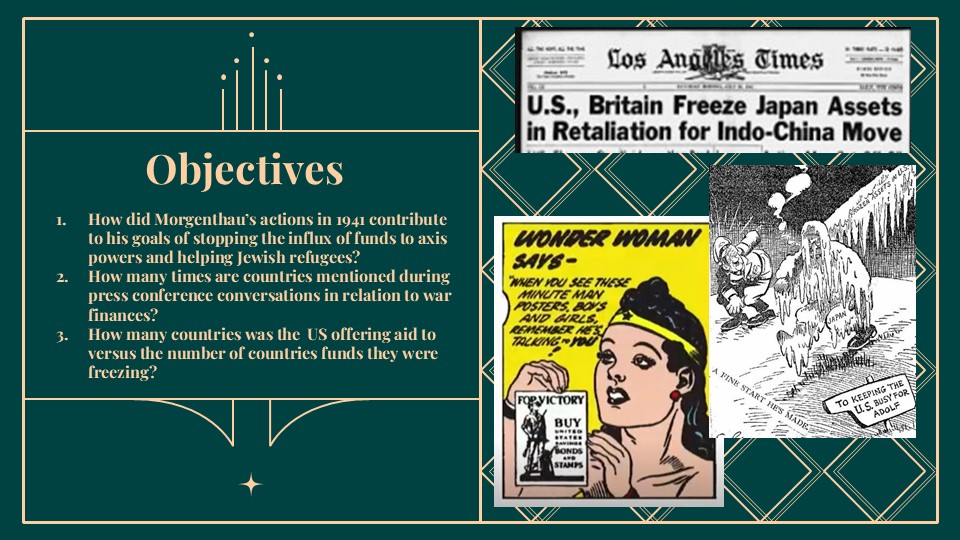
Figure 2. Template by Slidesgo, with icons by Flaticon and images by Freepik.
Software and Tools:
- Docdrop: OCR
- Adobe Acrobat: Removing excess pages.
- Convertio: Converting to .csv format.
- OpenRefine: Cleaning and manipulating data.
- Excel: Bar graph and exporting OpenRefine data.
- DataWrapper: Symbol maps
- Word Cloud Generator: jasondavies.com/wordcloud
Data Cleaning and Preparation
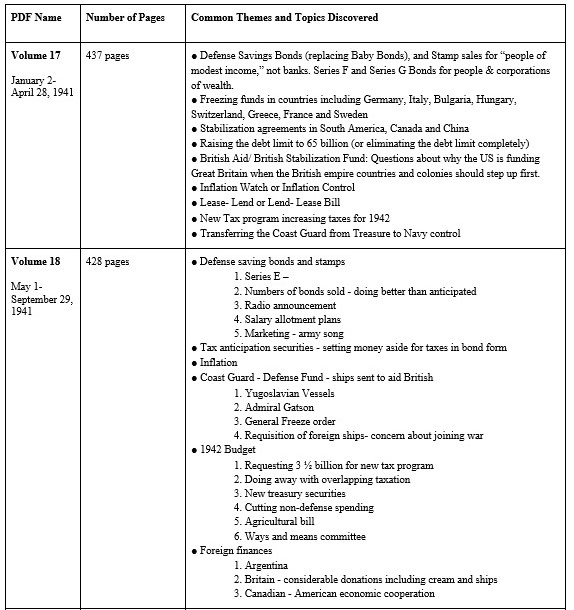
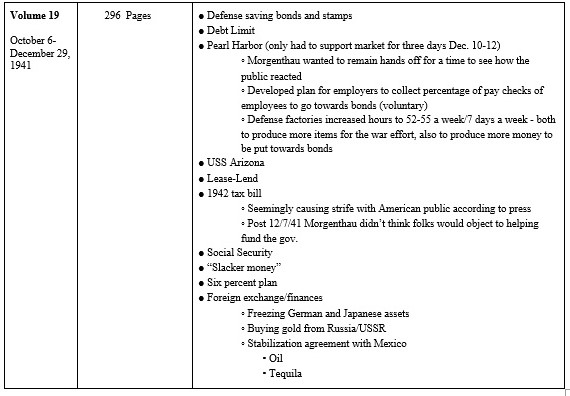
Our objective during the collection survey was to gain an understanding of the events happening in Morgenthau’s Treasury Office and around the world in 1941. To expand our knowledge, we each read through a volume. We took notes of common themes and topics throughout the press conference transcripts (Figures 3-4), and from these choose where to focus our computational analysis and story.
Modeling: Computation and Transformation
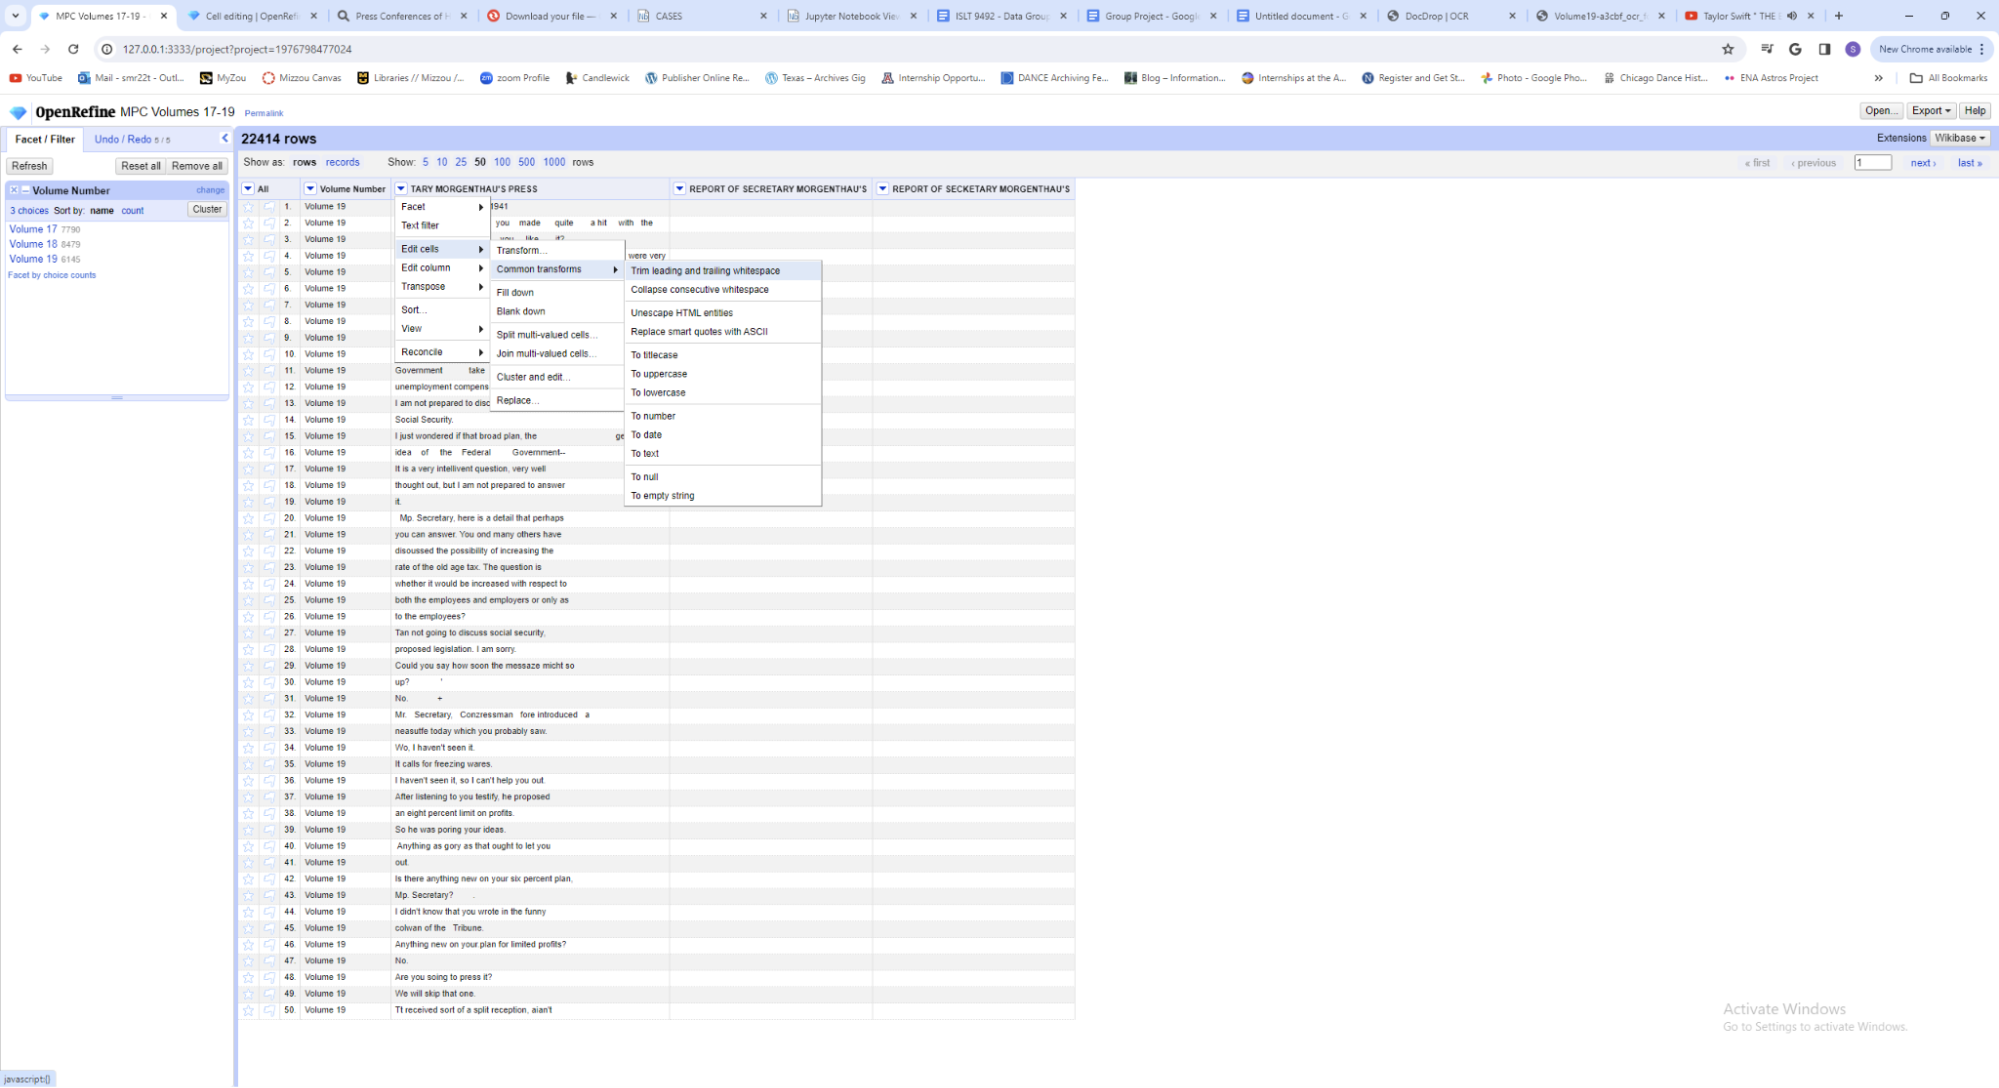
Step 4.1: We trimmed the leading and trailing white spaces and collapsed any extra white spaces through an “edit cells” transformation (Figure 5).
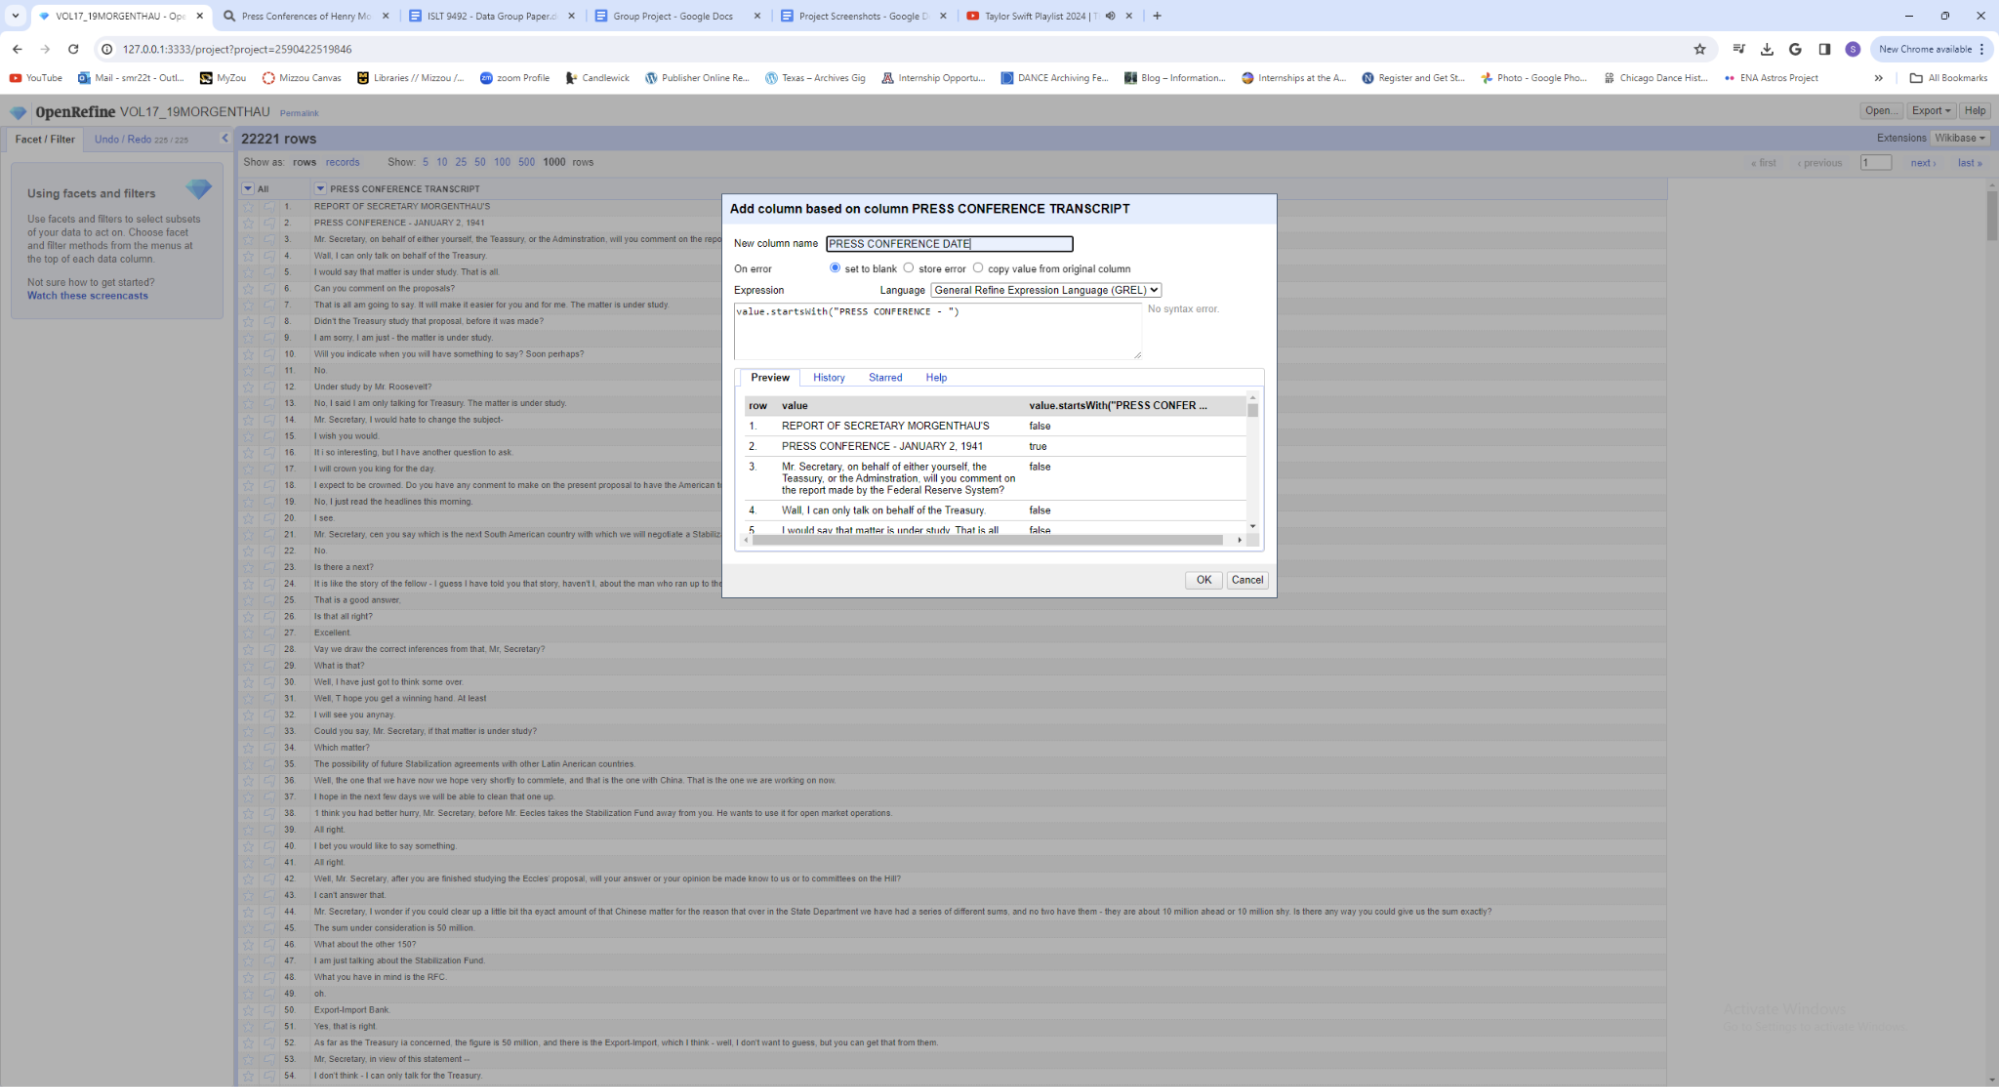
Step 4.2: We added a column based on the column PRESS CONFERENCE TRANSCRIPT to pull out the header/dates for each press conference using the command:
- value.startsWith(“PRESS CONFERENCE - ”)
This makes a new column called “Is Header” that assigns the Boolean terms true or false (Figure 6).
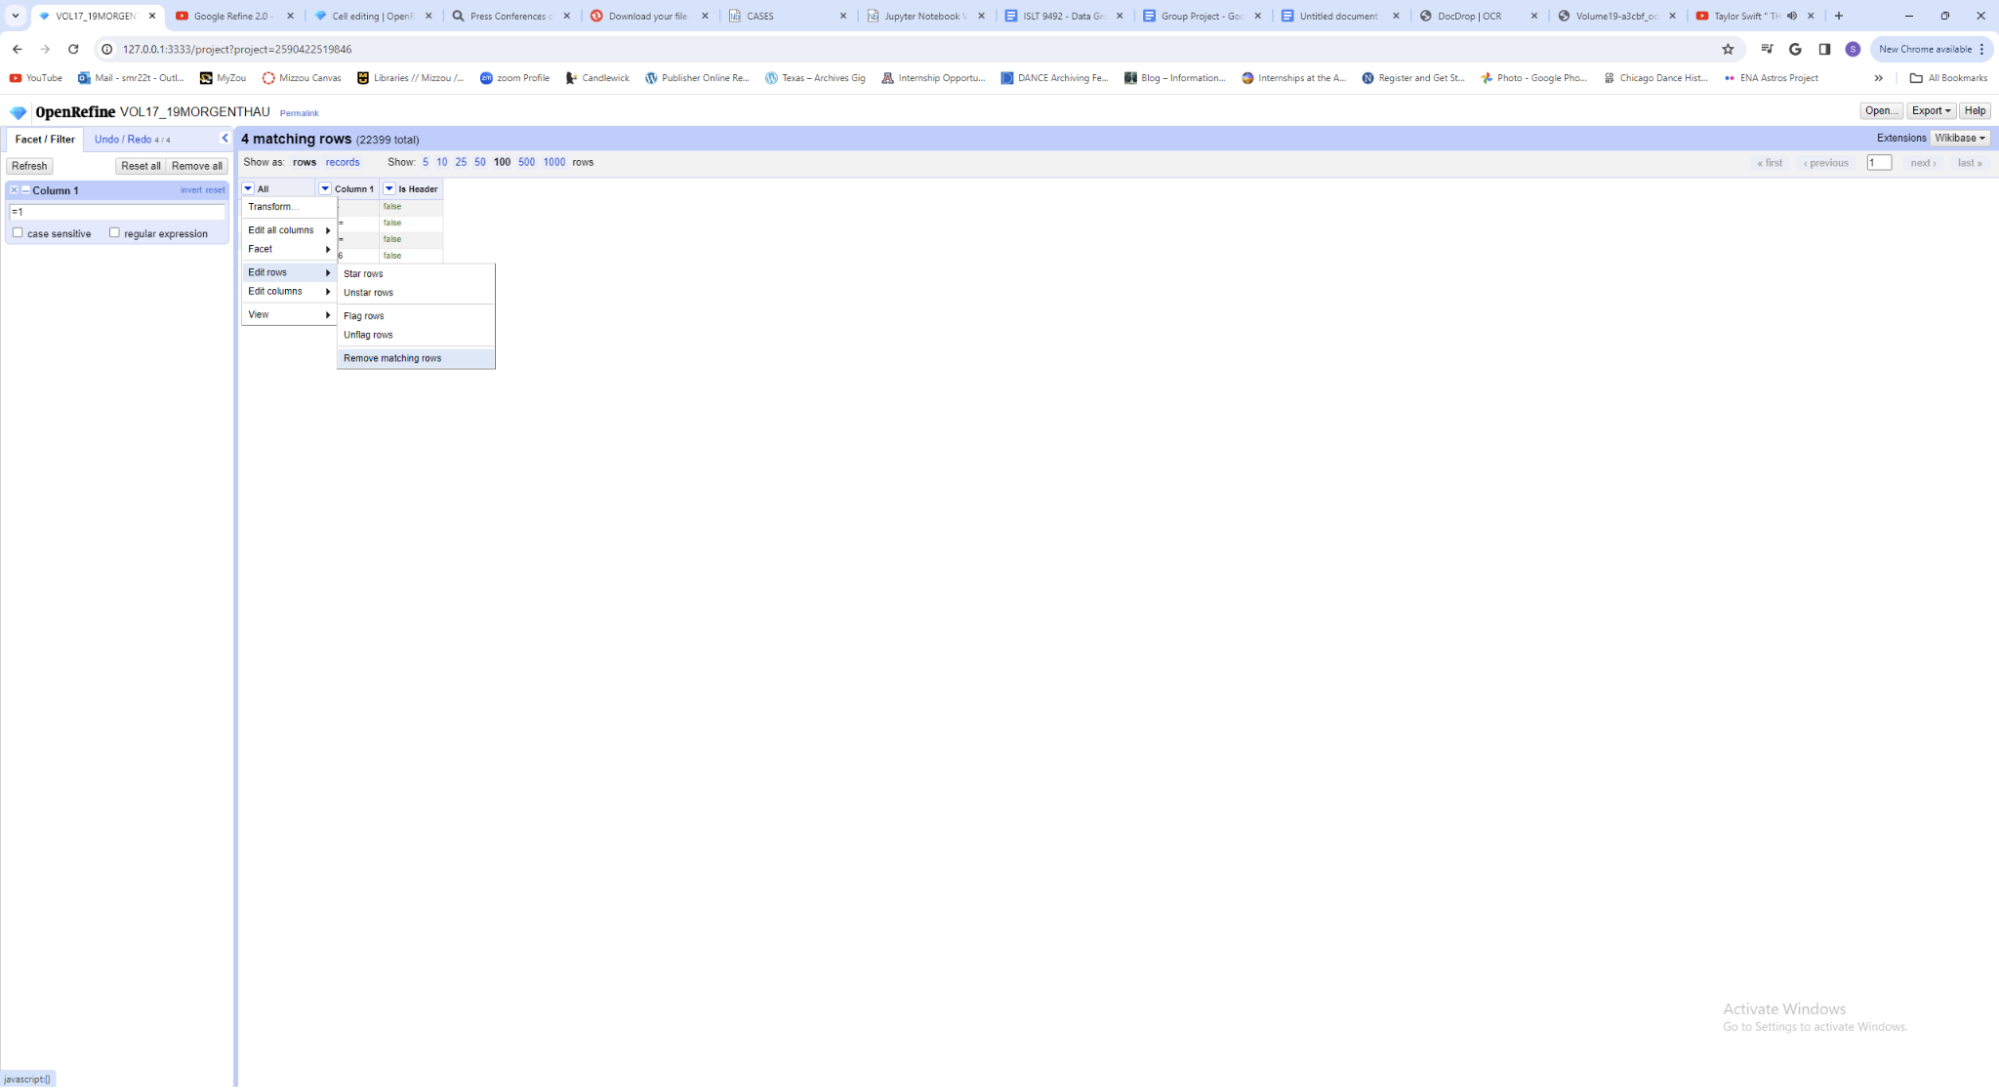
Step 4.3: We used the text filter to find erroneous lines like == or 8= and remove all matching rows to clean up the database. This single step eliminated around 200 unnecessary rows of data (Figure 7).
Step 4.4: We used the Cluster and Edit tool under “Edit Cells” to refine common phrases and words to a similar syntax and spelling. This step caught many OCR translation issues and allowed us to correct the errors with minimal effort (Figure 8).

Step 4.5: We also used the “Replace” function to mass-edit errors from the OCR process (Figure 9).

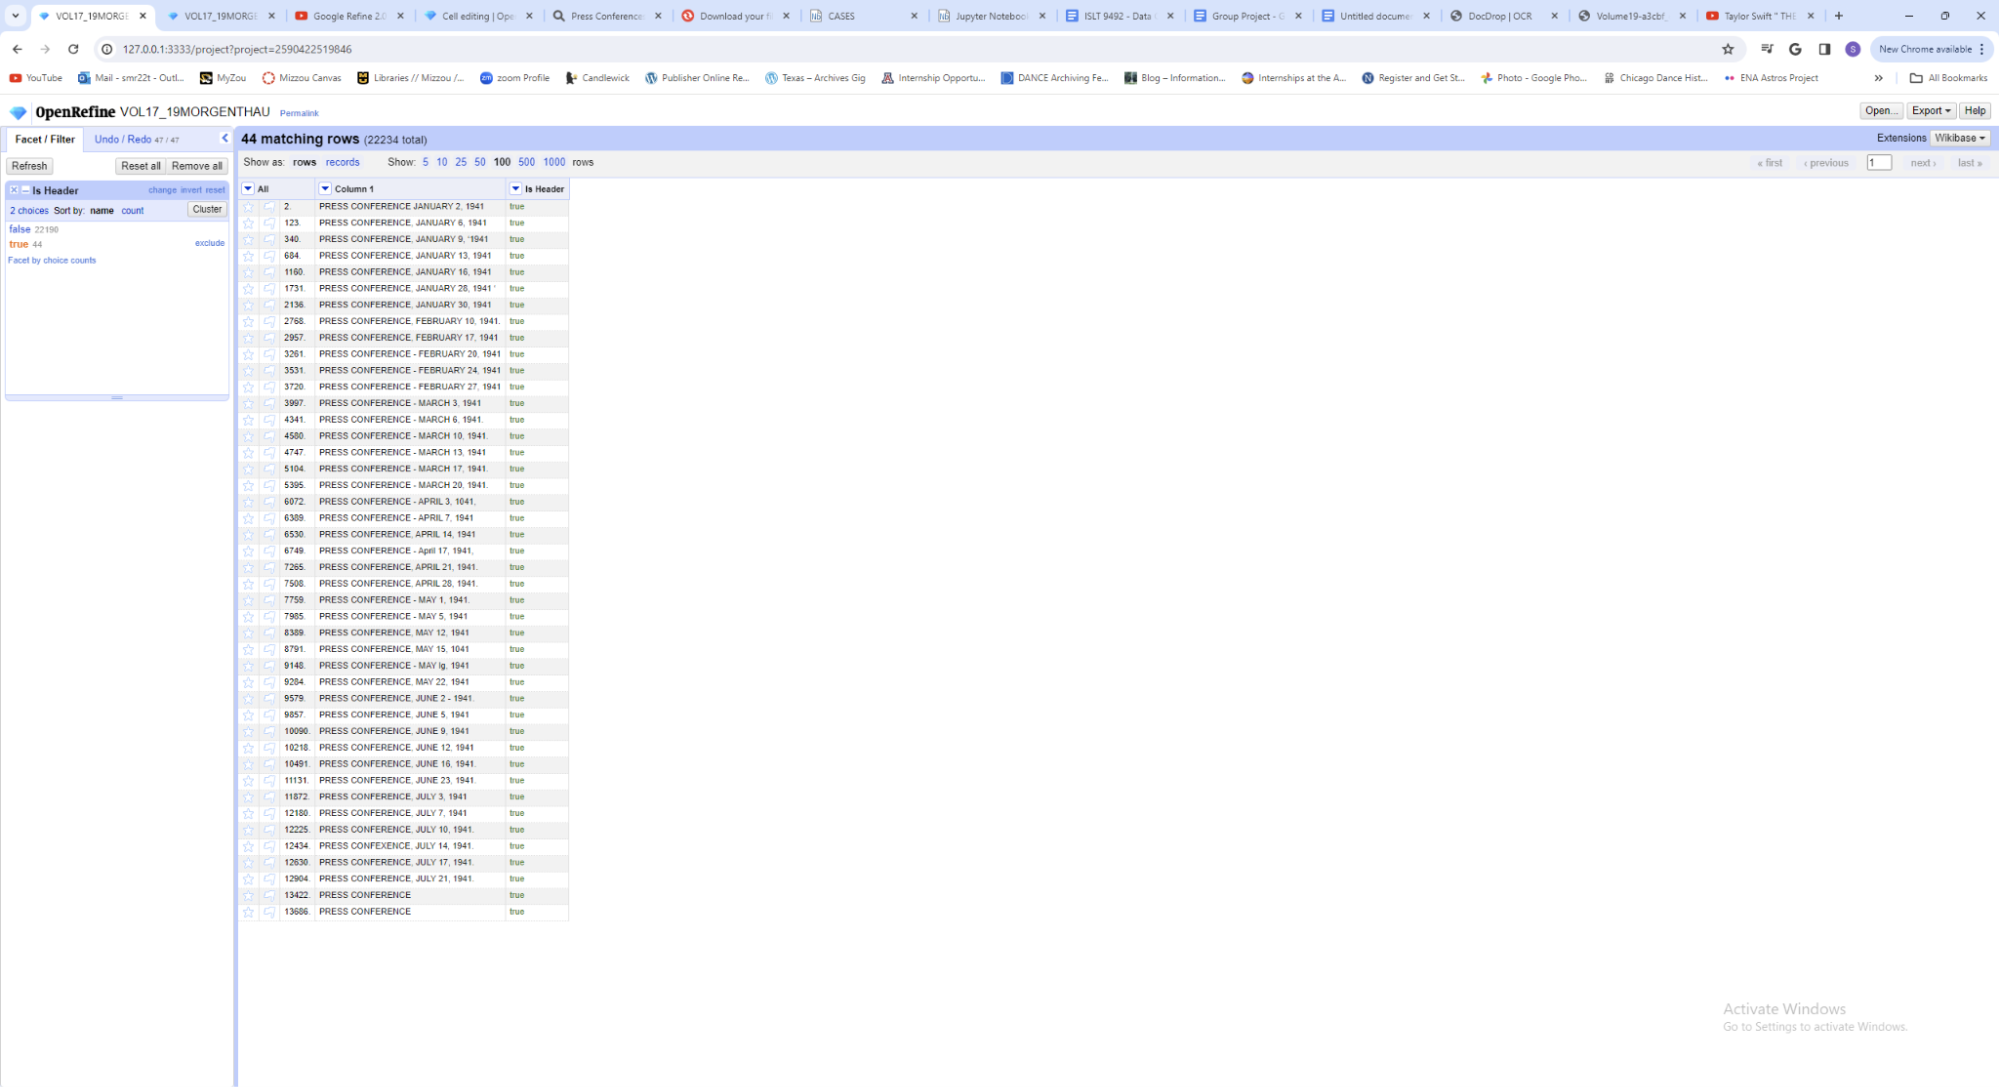
Step 4.6: We used a text facet in the “Is Header” column to sort out and work with the “true” or Press Conference Dates. Later we realized there were far more than 44 headers, but they were not being isolated because they did not start with PRESS as we specified. We had to repeat this step and Step 2 after searching for the names of the months and editing the text next to the date to ensure they began with PRESS (Figure 10).
Step 4.7: We added a new column based on the “Is Header” column and only displayed character values 18-37 so only the date showed up in the new column (Figure 11).

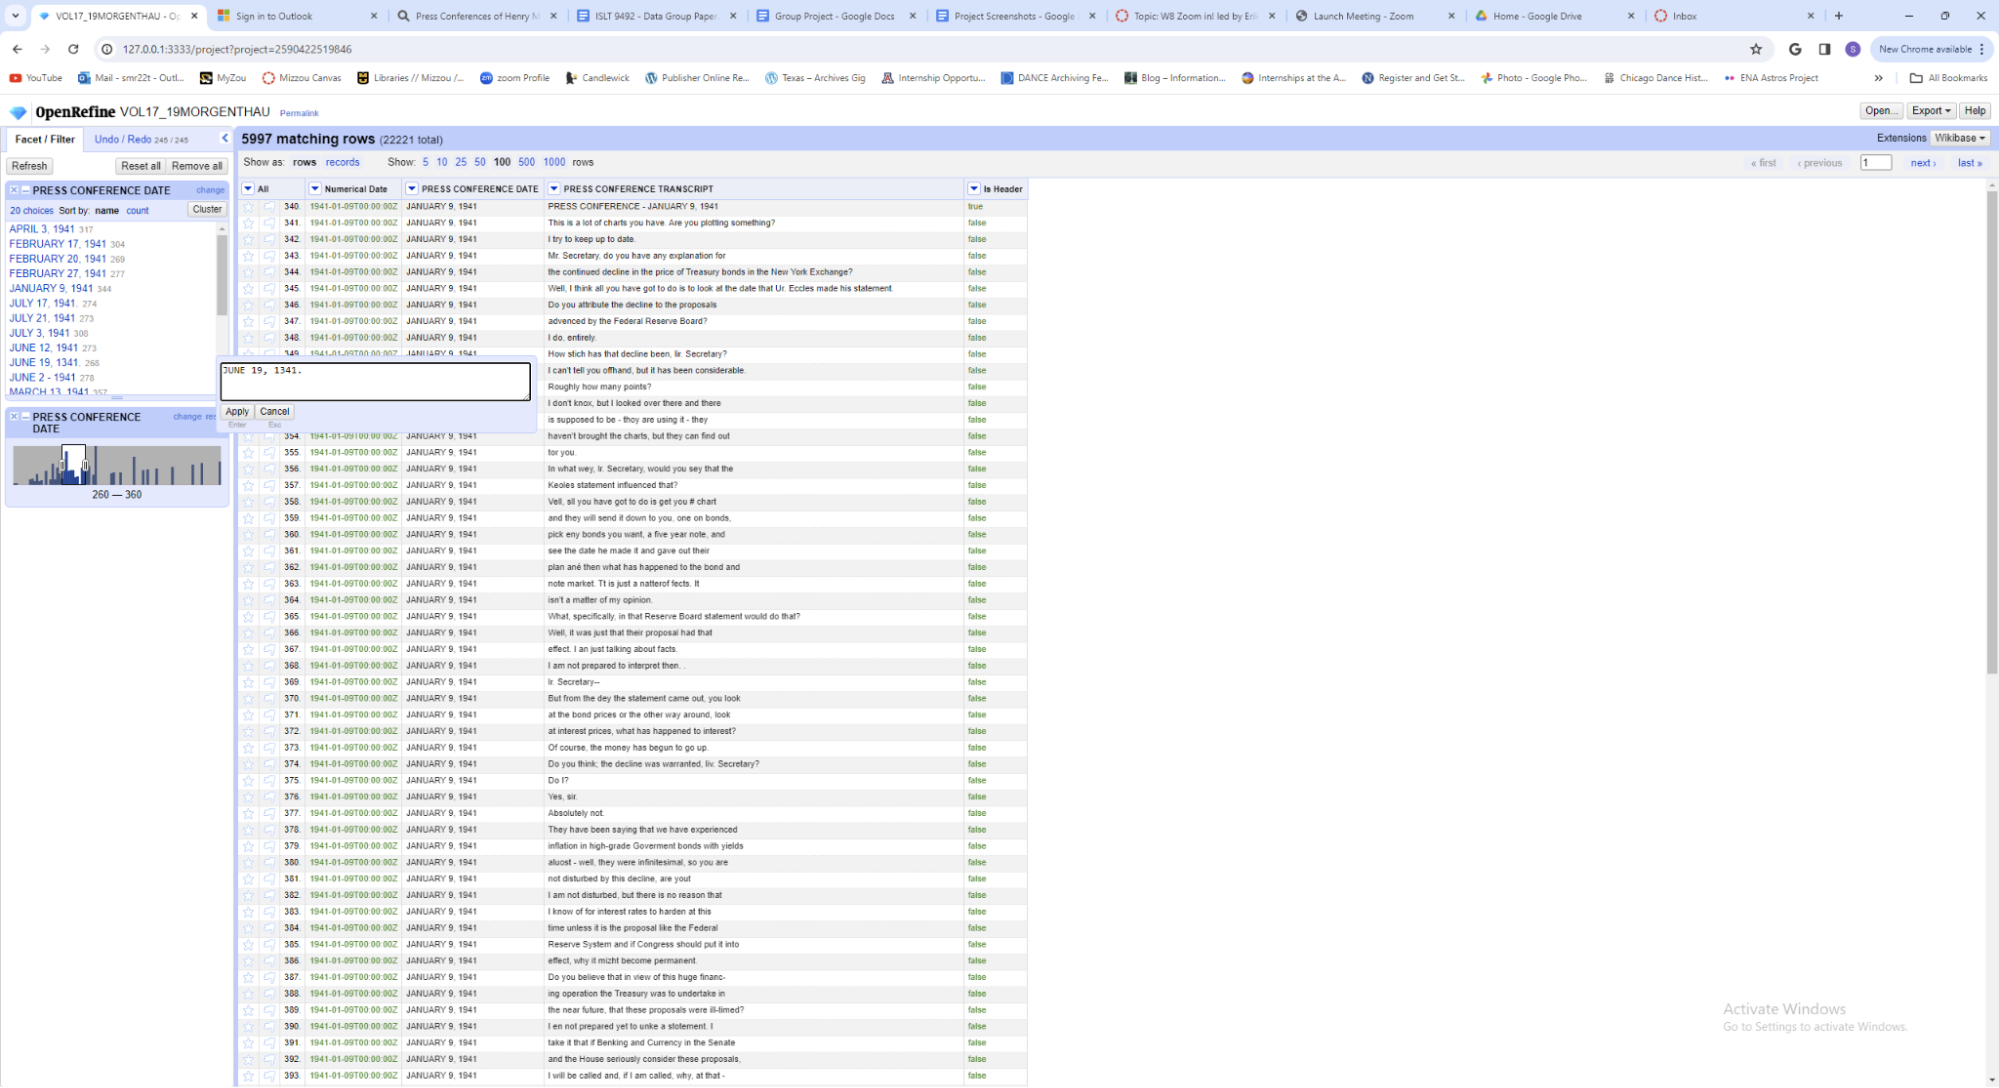
Step 4.8: Once we began our work in Excel, we realized some of the dates were still incorrect. To mass edit date mistakes, like 1041 or 1341 instead of 1941, we used the text facet tool to locate and edit the wrong years quickly (Figure 12).
Modeling: Visualization
To answer our research questions in a visual format, we used a text filter of the “Press Conference Transcript” column to search for important financial terms and country names. Once the filter was in place revealing only the data we needed, we exported the data to an Excel file for further manipulation.
In the case of country names, we searched for both the proper noun and the adjective form. For example, we counted both Greece and Greek in our data when discussing the country Greece. Similarly, the financial terms are presented in different ways but have the same meanings. For the term Freezing, we searched for “freez” and this isolated all the words related to the freezing of financial information. This technique also allowed us to locate any instances of the keywords that had a typo and correct them as need.
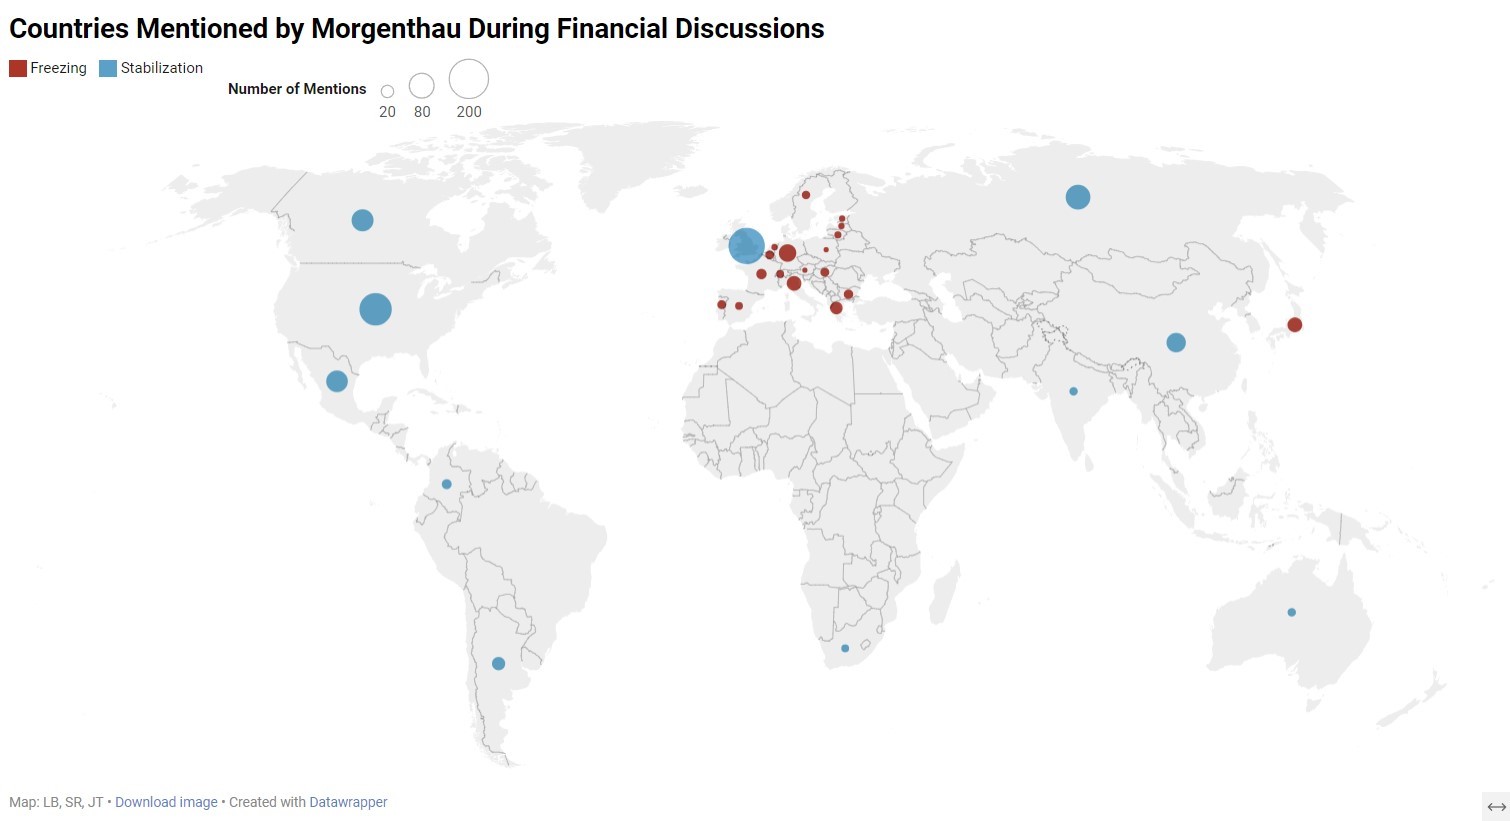
Symbol Maps: The dot maps (Figures 13 and 14) were created using Datawrapper. Data exported from OpenRefine was used to create the maps. The blue circles indicate countries that the United States worked to stabilize financially or provide aid in other ways. The red circles represent countries that had their financial funds frozen. The larger the circle the more mentions the country had in the 1941 Morgenthau Press Conference Transcripts. We chose to illustrate the whole world, but also created a zoomed in map of Europe, since there was a concentration of mentioned countries in that area of the world, and it was difficult to decipher on the world map.

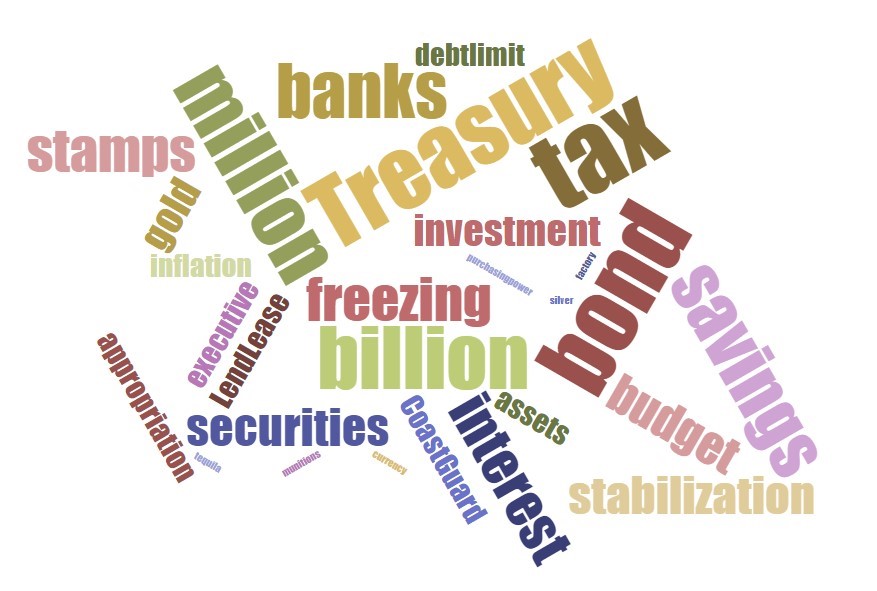
Word Cloud: The word cloud (Figures 15 and 16) was created using the Word Cloud Generator from https://www.jasondavies.com/wordcloud. Our word cloud is a collection of terms used frequently throughout Morgenthau’s 1941 Press Conferences providing the viewer with a glimpse into the topics covered throughout Volumes 17-19. The larger the size of the word, the more often that word was discussed between Morgenthau and his reporters. That implies topical importance or concern about the topic.

Bar Graph: Finally, the bar graph (Figure 17) shows a month-by-month look into the number of times a specific financial term was mentioned during 1941. This data was exported from OpenRefine into an Excel document, and Excel’s graph tool was utilized to create this visualization.

The visualizations we created distill over a thousand pages of PDF transcripts into three, easy to digest representations of historical information.
The symbol maps provide the viewer with a visual depiction on the countries most often discussed by Morgenthau and his reporters and answer our research question about country mentions in relation to war finances, freezing funds, and stabilization. It is clear by the large blue dot that Great Britain was substantially supported by the United States during 1941. Major Axis powers, like Germany and Italy have large red dots indicating that the United States did all it could to financially harm those countries. We were previously unaware of the financial contribution of the United States to South American countries during the war, but the map visualization ensures those countries are remembered and discussed.
The word cloud provides an overall picture of the topics of conversation related to finances in 1941. The enormous amount of money the United States invested in this effort is clear through the large font of the words ‘million’ and ‘billion.’ These words were used a total of 493 times over the press conferences of 1941. Bonds and stamps are also topics that our word cloud displays prominently. Bonds and stamps, along with the often-discussed taxes, are how the United States funded their support to Great Britain and other countries that needed stabilization and aid.
The bar graph breaks down many of the words found in the word cloud by usage by month. This visualization answers our research questions about helping refugees and stabilizing countries. Mentions of gold (light blue) are prominent in the months of January, September, and October. The graph shows that stabilization (orange) is a constant topic throughout the year. It is interesting to see that the mentions of bonds (dark blue) are high through May 1941, when the Defense Bond program was launched, but tapers away until it spikes again in December. This corresponds to the United States joining the war after Pearl Harbor, and “the people out there are letting their patriotism be demonstrated through their pocketbook” (Vol 19). This graph also leads to the question: What was discussed in November 1941 since the major topics of the year were only discussed briefly? Perhaps there were other terms not explicitly pulled from the data, like taxes and inflation, that were mentioned and not represented.
Ethics and Values Considerations
Throughout this project we engaged with ethics and values within a couple of contexts. Firstly, regarding the work we did, we strove to uphold archival ethics and values as outlined by the Society of American Archivists [9], while also being mindful of the ethics of computational science and working with data.
The goal of this project was to answer our research questions by creating a computational story that would ultimately allow users of these archival resources to not be overwhelmed by the sheer mass of them. To easily take away key points held within the records to aid and guide their research. That goal ties into the ethical values of “access and use” as well as “history and memory” and was mainly accomplished by keeping context top of mind [9]. That is: the historical context our records exist within, the time when they were created as well as who they were created by and why, and also the context of our three volumes being a part of a much larger record set. It meant that our records were not the beginning and the end but work along a continuum of other records that they interact with, ala the rest of the Morgenthau Press Conferences, and anything else held with the FDR Library and Museum. The “history and memory” in our findings will only be enriched by their connection to the other projects in this course.
Secondly, we examined the ethics of the records themselves. Both as items that the public can engage with and what that means, as well as how the content of the records showcased the ethics and values of Morgenthau, the FDR administration (particularly as it pertains to wartime) and the press corps. The fact that we are able to interact with the records at all is incredible. It is a testament to FDR and his commitment to “open government” [10]. It gave the American people a chance to see how their government was working with the existence of the FDR Library, which began with the two goals of “simultaneously preserv[ing] and provid[ing] public access to the records of his presidency” [10].
The contents of the records continue this role of “open government” by showing that Morgenthau was interacting with the press on a very regular basis, giving them updates on what was occurring in the Treasury Department. This also gave insight into the FDR administration and how they were enacting their “economic warfare”, and how that in turn would affect the American people.
It is difficult to gauge the ethics of the reporters who were present, because even though we have the questions they asked, which are somewhat enlightening, we don’t know how they reported the responses because we don’t know their bylines or what papers they worked for. They were very persistent, for example, in inquiring about income taxes and how that would affect the American people, but Morgenthau was also consistent on avoiding answering until he felt he allegedly had everything worked out with all other parties interested in the potential rise of income tax (Vol. 19). Whether this was ethical on Morgenthau’s part, or a way to avoid implicating raising taxes which may reflect badly on the Treasury and/or the administration is hard to know for certain, given that our only context for these exchanges is the transcripts.
These ethics and values considerations not only guided our work but allowed us to gain deeper insights into the records, unlocking more connections as well as opening more avenues to examine the data we chose to focus on (Figure 18) (LB).
Summary and Suggestions
Telling our computational story about the year 1941 in Henry Morgenthau Jr.’s Treasury Department began by developing our three research questions which highlighted America’s “economic warfare” before officially entering WWII after Pearl Harbor (Figure 19). This story involved: reading through the volumes and finding common themes, manipulating, and extracting the data revolving around the themes utilizing various softwares and computational workflows, and once the data was extracted constructing visualizations that would allow the data to tell its story in a way that wasn’t overwhelming for future users.
The crafting of this story was not without its issues, mainly resulting from how our group was able to interact and interpret the records. The problems encountered are as follows: Different spellings of country names (ex. Esthonia is now Estonia) and countries that no longer exist or have been split into different countries (Slovakia). As well, some countries, such as Yugoslavia and Czechoslovakia, are no longer countries. So, although they had mentions in the transcripts, it was not possible to make note of them on a current world map.
Terms like Lend-Lease, were often inverted or shortened during discussion (e.g. Lease-Lend, Lend Bill, Lend-Lease Act, etc.). Another issue is that some pages repeat in the collection which would skew some numbers. Also, because these records are transcripts of conversations it was difficult to tell the tone at times, and if things said were a joke or with serious intent. A lot of context had to be gleaned from outside research if one was not very familiar with economic policies of the time, or the types of phrases used and their meaning.
With such a large data set of course there was more we would have liked to have done. For this computational story we focused more on what was happening internationally, but not on what was happening domestically with inflation, as well as income tax and the Coast Guard, etc. With more time we would have liked to touch on these things further and see how domestic and international economic issues were influencing the other, as well as the American people.
Overall, this research, and the visualizations that came out of it, will ultimately benefit the future users of the Henry Morgenthau Jr. press conferences collection. Archives can be intimidating to parse through, or perhaps seen as time consuming to utilize because of their breadth and depth. While finding aids can certainly help paint a clearer picture of what lies within records, there are other ways to aid users, such as data modeling and computational methods.
Our project showcases that, clearly and concisely presenting the most prevalent topics of 1941 in the Treasury Department in ways that will facilitate use and access. If a researcher is interested in the topic of Bonds in 1941 all they’d need to do is look at our bar graph and see that March had many mentions as compared to other months, so that may be a good place to start their investigation. Data modeling is a way to make records seem less like a dense forest with mysteries around every corner, and more like a vast park with well-marked paths, providing signposts for more directed discovery.
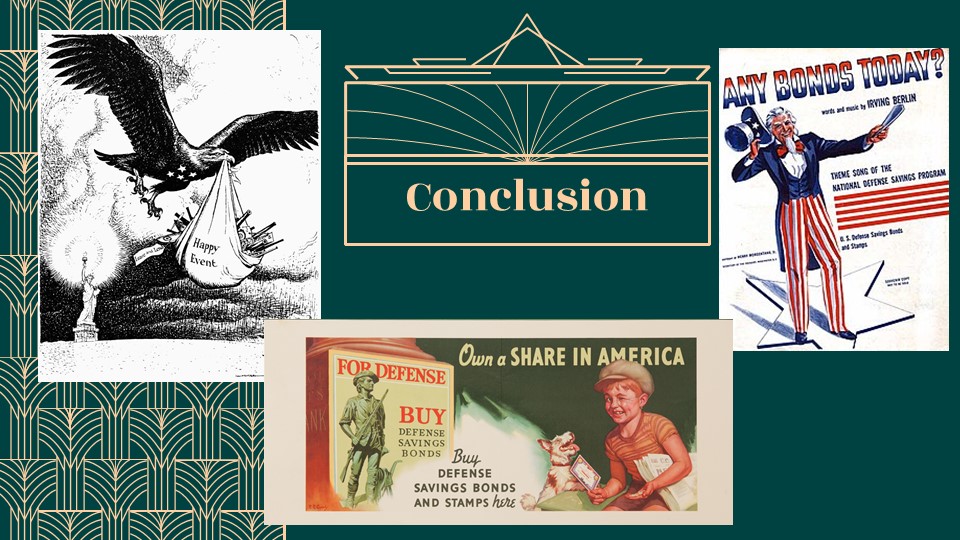
Figure 19: Template by Slidesgo, with icons by Flaticon and images by Freepik.
References
- Jewish Virtual Library. (n.d.). Henry Morgenthau Jr. https://www.jewishvirtuallibrary.org/henry-morgenthau-jr
- United States Holocaust Memorial Museum. (n.d.). Americans and the Holocaust: Henry Morgenthau Jr. https://exhibitions.ushmm.org/americans-and-the-holocaust/personal-story/henry-morgenthau-jr
- U.S. Department of State Archive. (n.d.). Lend Lease and Military Aid to the Allies in the Early Years of World War II. https://2001-2009.state.gov/r/pa/ho/time/wwii/81508.htm
- U.S. Department of State Archive. (n.d.). The Atlantic Conference and Charter, 1941. https://2001-2009.state.gov/r/pa/ho/time/wwii/86559.htm
- U.S. Department of State Archive. (n.d.). Japan, China, the United States and the Road to Pearl Harbor 1937-1941. https://2001-2009.state.gov/r/pa/ho/time/wwii/88734.htm
- Treasury Direct (n.d.). The Volunteer Program and Series E Savings Bonds. https://www.treasurydirect.gov/research-center/history-of-savings-bond/volunteer-program/
- Polk, J. (October, 1941). Freezing Dollars Against the Axis. Foreign Affairs, 20(1), 113-130. https://www.jstor.org/stable/20029134
- American Historical Association (n.d.). EM 13: How Shall Lend Lease Acconts Be Settled? (1945). https://www.historians.org/about-aha-and-membership/aha-history-and-archives/gi-roundtable-series/pamphlets/em-13-how-shall-lend-lease-accounts-be-settled-(1945)
- Society of American Achivists. (2020, August). SAA core values satement and code of ethics. Society of American Archivists. https://www2.archivists.org/statements/saa-core-values-statement-and-code-of-ethics
- Franklin D. Roosevelt Presidential Library and Museum. (2016). Library history - FDR presidential library & museum. https://www.fdrlibrary.org/library-history