- Creator: Valerie Sallis
- Source Available: https://archive.org/details/charlottenorthca1911pied
- License: Creative Commons - Attribute 4.0 Intl
- Attribution: This work is based upon digital assignments completed by UMD Students in INST742: Implementing Digital Curation
5. Revisualizing Geographic Disparities: Examining Trends in Racial and Economic Inequality on the Streets w/o GIS:
- Author: Valerie Sallis
- Abstract: Examining racial disparities in key areas of Charlotte, using faceted clustering of types of homes.
- Dataset: Full datified Directory (16,000 entries), 1911 Sanborn map, 1910 Census
- Tools: Excel, OpenRefine, Tableau
- Video: https://youtu.be/hyeYfOKnFBs (9′ 57″)
Computational Thinking
This exercise utilizes the following elements of computational thinking:
Data Practices:
- Manipulating data
- Analyzing data
- Visualizing data
- Using computational models to understand a concept
- Preparing Problems for Computational Solutions
- Assessing Different Approaches/Solutions to a Problem
- Understanding relationships within systems
- Thinking in levels
Overview of the Project
This project examines the racial and economic disparities on several of the most populous streets in Charlotte in 1911 using simple database manipulation techniques in OpenRefine and Excel and visual graphs created in Tableau Public. The purpose behind this method is to find alternative methods for analyzing geographic data using free database and visualization tools that may be easier to access for a single researcher or a small institution. While GIS software is a powerful tool and would be a natural choice for analyzing geographic disparities in data, not all institutions may have staff who are trained or feel confident using GIS software, as licenses for GIS programs with robust user interfaces and technical support like ArcGIS can be expensive and open-source programs like QGIS require signficant start up knowledge or self-education.
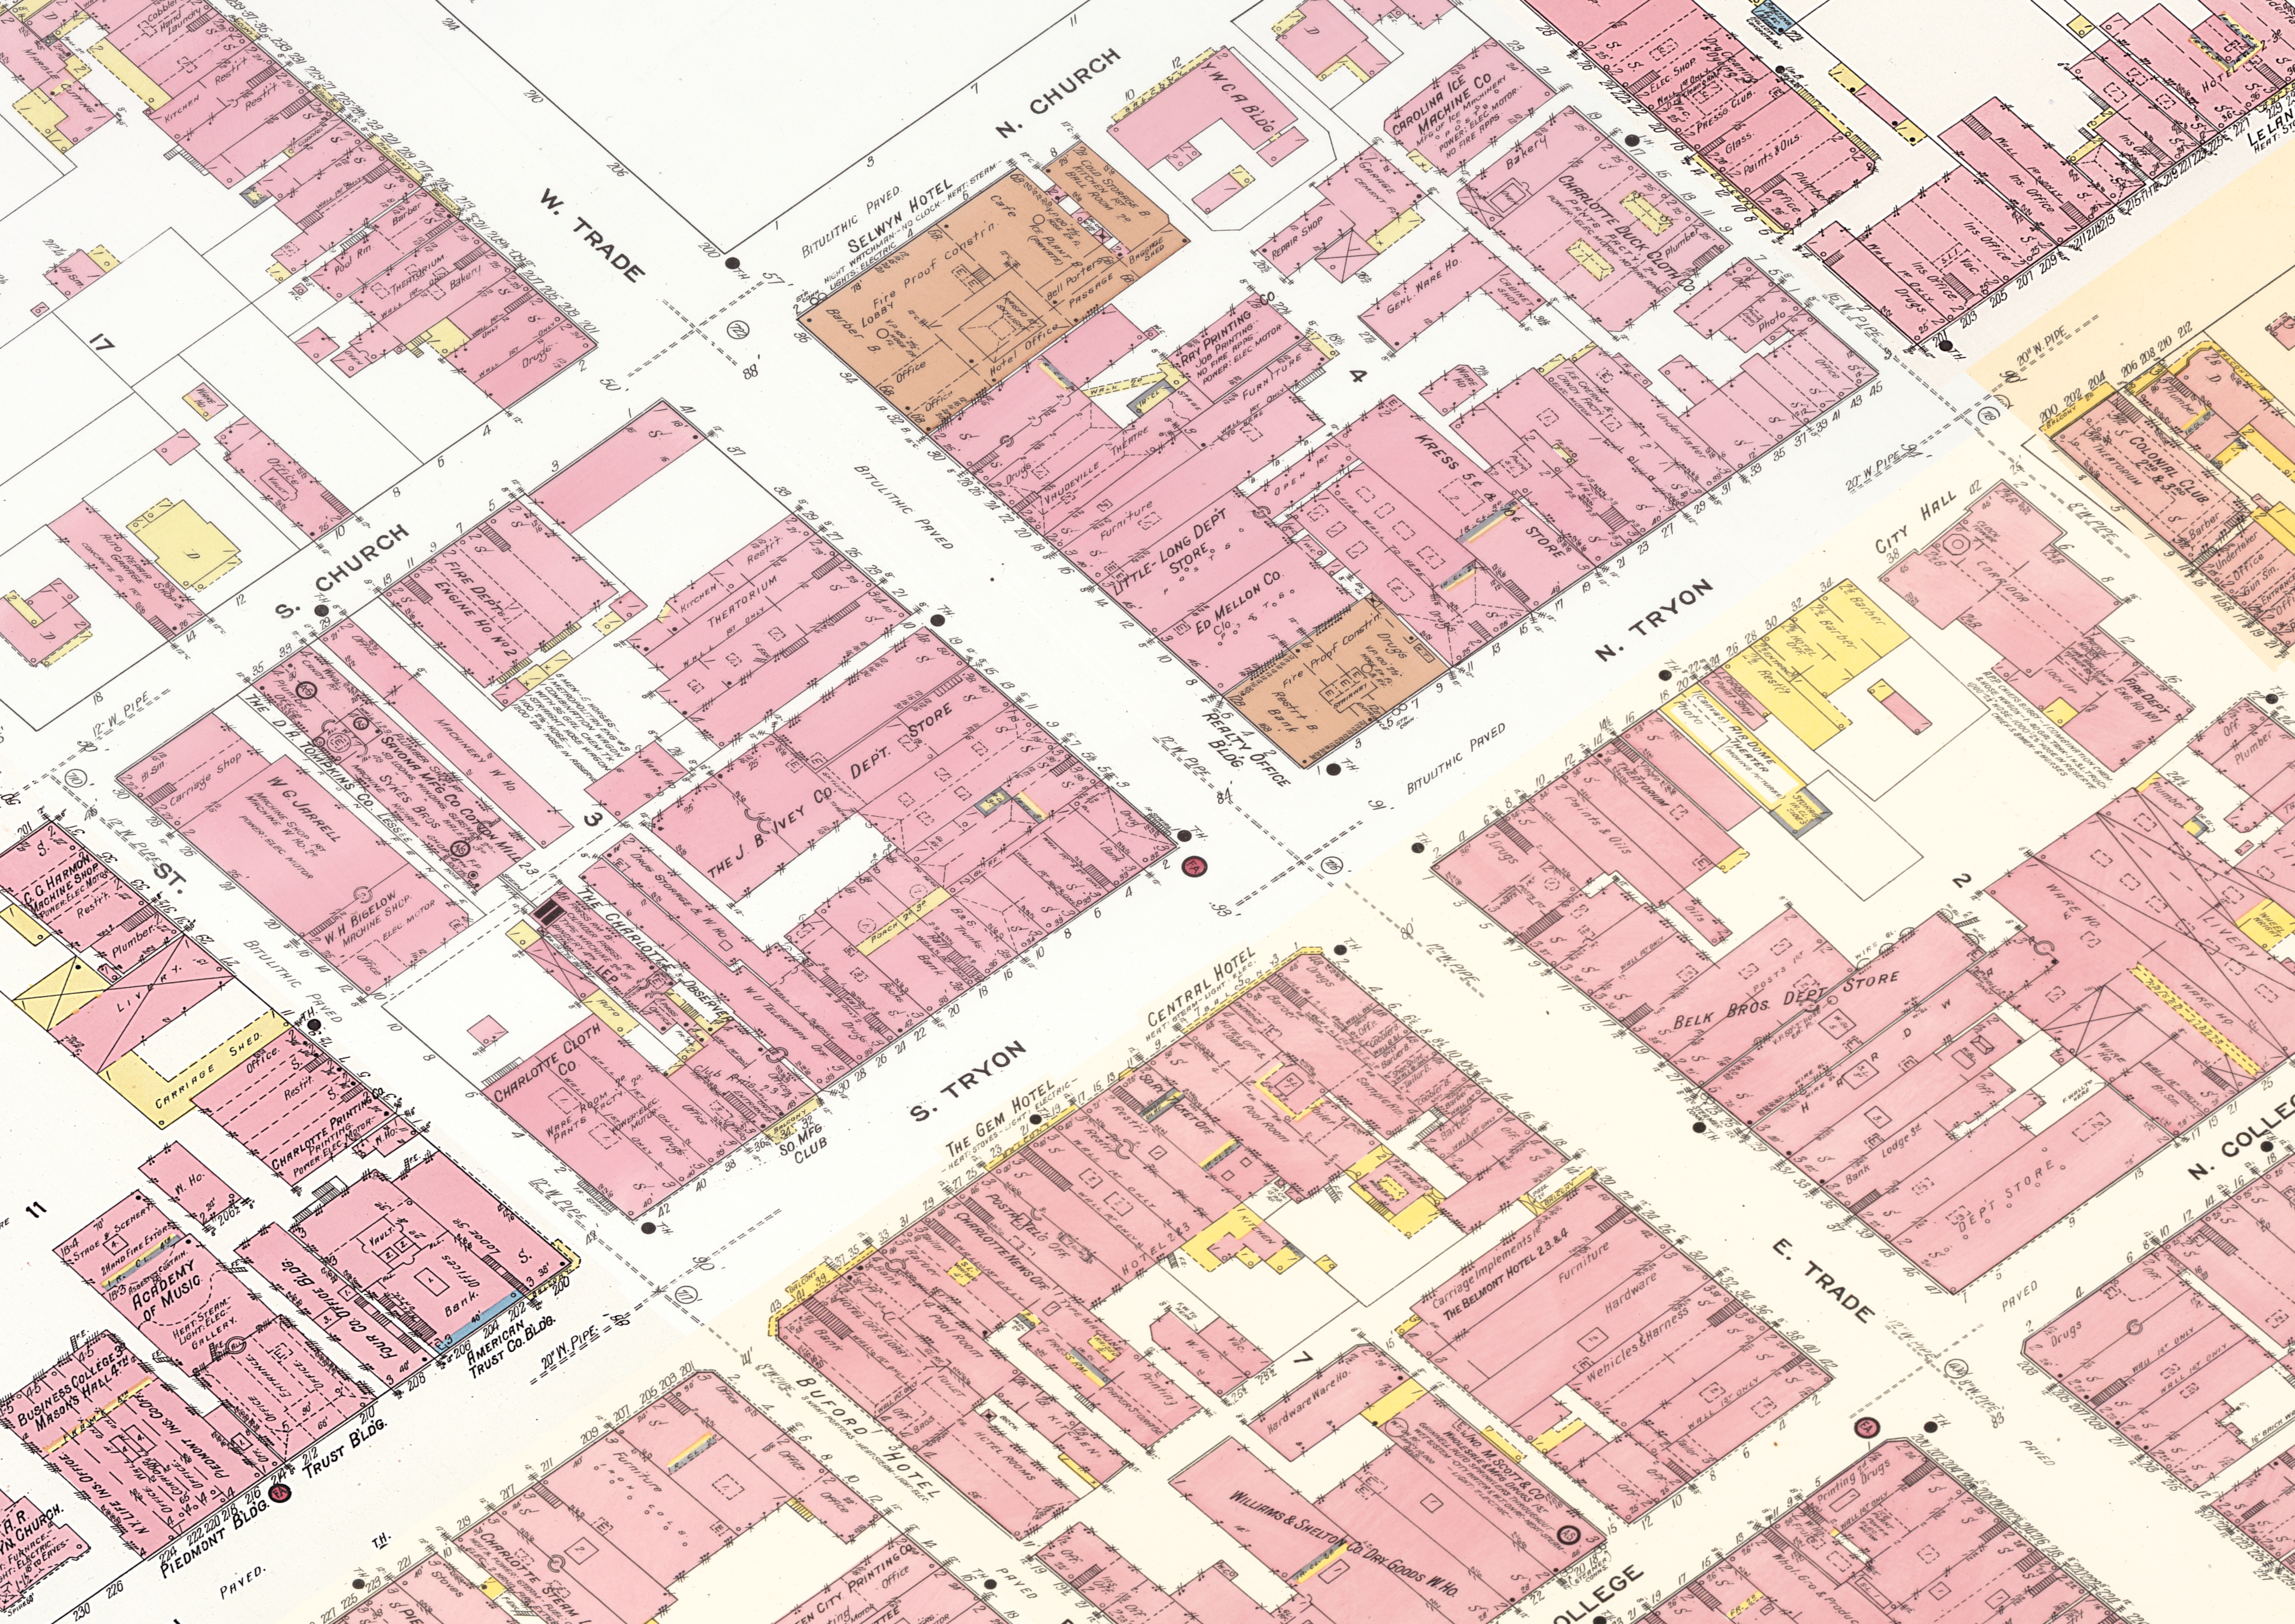
Charlotte makes an interesting candidate for geographic analysis because it has an unorthodox layout. The historic area is designed on a grid, however the grid does not follow a N/S axis. Rather the grid sits on a skewed axis formed by the intersection of Tryon St and Trade St as seen in this Sanborn Fire Insurance map from 1911. This project attempts to find patterns in the data in terms of racial makeup and economic equality using the Tryon St/Trade St axis as the pivot point for analysis.
Objectives
- Examine how racial and economic inequities were concentrated geographically in Charlotte in 1911.
- Use simple data manipulation and cleaning techniques that would be accessible to researchers/library and arhival staff with minimal database training using OpenRefine and Excel.
- Explore options for visualizing data with free software like Tableau Public.